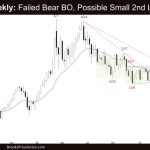
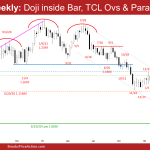
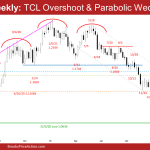
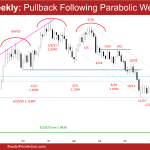
Market Overview: Crude Oil Futures The weekly chart formed a Crude Oil strong pullback testing the breakout point (April high; trading range high) and the 20-week EMA. The bulls want the 20-week EMA to act as a support and a reversal up from a higher low. The bears want a reversal down from a large […]
Crude Oil Failed Bear BO, Possible Small Second Leg Down
Market Overview: Crude Oil Futures The Crude Oil futures moved lower last week, but it was a failed Bear BO (breakout). Price rebounded strongly and finished with consecutive bull bars by Friday on the daily chart and a bad bear close on the weekly. After breaking a trend line, the bulls are setting up a […]
EURUSD potential final flag & 2017 low magnet below
The EURUSD Forex sell-off is strong and in a tight bear channel. Bears want a test of 2017 low and a strong breakout below. Because of the strong selling pressure, odds slightly favor sideways to down.
However, because of the 1) oversold conditions, 2) trend channel line overshoot and 3) parabolic wedge and 4) potential final flag, traders should be prepared for a 2-legged pullback (bounce) which can begin at any moment.
EURUSD Forex parabolic wedge & trend channel line overshoot
The EURUSD Forex broke below March 2020 low. The next target for the bears is the 7-year trading range low. The sell-off is in a tight channel which means strong bears.
The monthly and weekly candlestick overshoot the trend channel line this week. There is also a parabolic wedge on the chart. While lower price is slightly more likely, traders should be prepared for a 2 legged sideways to up pullback (bounce) which can begin at any moment.
EURUSD in pullback from parabolic wedge on weekly and daily charts
EURUSD Forex: Weekend Market Analysis The EURUSD Forex is in a pullback from parabolic wedge sell-off testing the 700-pip measured move which started in October 2020. Traders are monitoring whether the bulls can create consecutive bull bars closing near their highs or the pullback is more sideways with weak bull bars. The leg down from February is […]
Emini weak pullback from parabolic wedge buy climax
Market Overview: Weekend Market Analysis SP500 Emini weak pullback phase on daily chart following a parabolic wedge buy climax at a trend channel line. Pullback from a parabolic wedge buy climax typically has at least a small 2nd sideways to down leg. The bulls want a test of the trend extreme. The EURUSD Forex is […]
Emini’s November parabolic wedge reversal should be minor
Trading Update: Wednesday November 10, 2021 Emini pre-open market analysis Emini daily chart Monday was a sell signal bar for a parabolic wedge reversal buy climax that was testing the top of the 6-month bull channel. Yesterday triggered the sell signal by breaking below Monday’s low. Since yesterday closed below its midpoint and below Monday’s […]
Emini at top of parabolic wedge and bull channel
Trading Update: Monday November 8, 2021 Emini pre-open market analysis Emini daily chart Parabolic wedge and bull channel rally (October 7, October 26, November 5) at top of bull channel (May 7, September 2, November 5). Probably 1 to 3 days of profit taking this week, possibly started on Friday. Friday was a bear bar […]
Emini possible minor reversal from parabolic wedge buy climax after FOMC
Trading Update: Friday November 5, 2021 Emini pre-open market analysis Emini daily chart Extremely strong bull trend. Will gap up today. Parabolic wedge buy climax that is testing top of tight bull channel at 4693 created by October 7 and September 2 highs. Next targets are 4700 Big Round Number and top of channel created […]
