The support forum is built with (1) General and FAQ forums for common trading queries received from aspiring and experienced traders, and (2) forums for course video topics. How to Trade Price Action and How to Trade Forex Price Action videos are consolidated into common forums.
Brooks Trading Course social media communities
The big BO bar COH and breaking above the last 40-50 bars was so big that it alone deserved more up (dominant feature), either creating another TR or a bull trend. When they got weak FT, the TR premise got stronger but your DT Signal Bar was only a few bars away and was preceeded by two stronger bull bars, so it was low probability and too early to start selling there. At your next short, you had bars reversing every single time so it was becoming fuzzy (TR behavior) and, therefore, selling below bars was still low probability.
@ludopuig Thanks for the input!
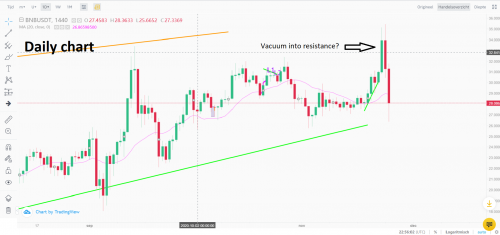
Looking at it after reading your comment, I see that chart a bit differently. Even without looking at the outcome. Indeed it turned out ther was another Bull Leg. Could I interpret that Bull Leg as exhaustive? Because late in the Trend, and maybe vacuuming into resistance (see daily chart).
@marvinbertonyahoo-co-uk Happy to help!
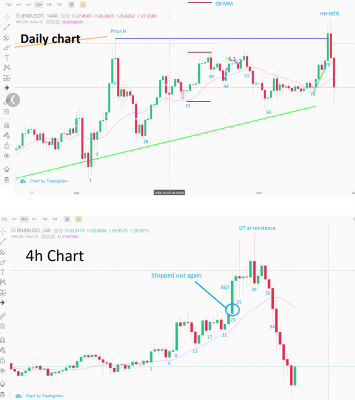
It is always hard to mix info coming from different charts and, specially, it is important to not get fooled when in hindsight looks as if it was pretty easy. Because of that, Al recommends sticking to one chart and take action based on its reading, this including drawing your HTF important magnets in your chart of choice. In your case, you should draw in your 4h chart the resistances from 9H (prior daily H) and 51H (daily DB 31 58 neckline). And that's it with it.
Of course, other traders may have different opinions about trading multiple charts and, as long as they are profitable, it is fantastic but when learning it is as simple as that: while you are learning and therefore not able to analyze a given chart profitably, will be adding new charts that you can't analyze well neither help you?
Now in your 4h chart:
* 8 COH, closes above many bars and it is a huge compared with the previous ones so the bulls are telling you that they will try to reach the daily magnets above, so you need to be looking to buy. You should also draw your MM based on your chart (TR MM and BO height MM). BTC
* 9 Bear bar, so weak FT, but doji. Buyers below.
* 10 H1 is an Ok buy, stop below 8.
* 14 is another H1 but LP because the two strong bear bars 12 and 13. You can buy if you use the correct stop (below 8) and bear another leg down.
* 17 is a BO PB 15 and you have trapped bears (16 weak DT) so you can buy above, stop below 13.
* 21 is BO PB 15 and DB 17 near the EMA so this is higher probability, and because your SB is good you can place your stop below. This is the best trade for beginners, the one you should strive to take and manage correctly.
* 22 BTC
* 23 BO COH; more up
* 24 FT so still BTC but at or near the daily magnets. Watch out!
* 25 looks as an attempt to break above daily magnets and you are getting a strong reversal. 24BTC dissapointed traders
* 26 H1 but doji and 25 strong reversal at HTF resistance. Don't buy.
* 27 another doji. BTC definitely exit.
* 28 Bull bar COH but previous for bars overlaping dojis, possible FF or maybe the start of a TR, and you are pretty high. Wait.
* 29 DT 25, FF. Swing short but big bar so big risk.
* 32 BO PB (2nd entry short) 29. 30 DB 25 bulls are trapped. Sell!
* 34 3 consecutive bear bars, bodies growing, Bulls panicking. STC. First target: bottom of climax 21L.
The above analysis is easier written that followed in real-time because most trades require a big risk, so you must focus in the ones that make you feel confortable and try to master them. Once you start catching those favorite trades in your chart you can decide to add more charts or, maybe, you decide you are ok trading one chart and keep adding new trades in your chart.
These commentaries are immensely valuable.
The analysis in your last reply wasn't much different from mine. The game of BO-bulls, evolvig from disappointment to panic was what I already saw before the last BO. I probably should have judged that as a final flag. Or maybe had stayed in position to scale in higher.
Thanks again.
Marvin
Huy Guys,
If you want you can skip the green part. It is nothing more than a result of being alone the whole time.
Long time no see. The period around end november, I was actually just doing something, without really knowing exactly what. I have had many moments where I thought I was one with the market. But the statistics strongly advise me not to quit my job, and go trading.
This hasn't changed much mean while. I estimate I will be needing at least 3 to 4 years to get where I want to, IF I ever get there.
Since the last post, I took a step back. Not by not trading. But by switching to a higher time frame. Very often I was in a trede, and was prepared to scale in. But when the time had come to scale in, I was emptying my son's pisspot, or it was time to leave to work. Or the neighbor asked me if I could come and help him move his new furniture.
Or I was simply too lazy to be a hundred procent focused.
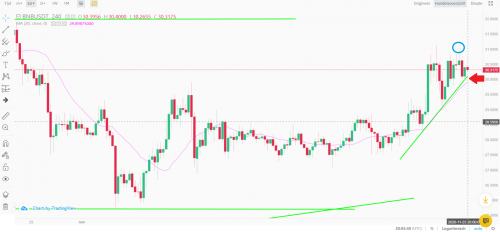
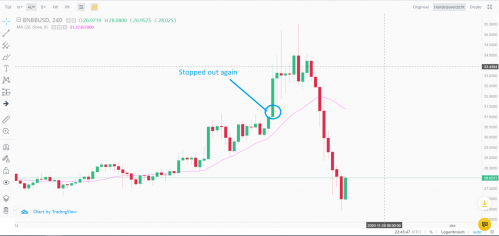
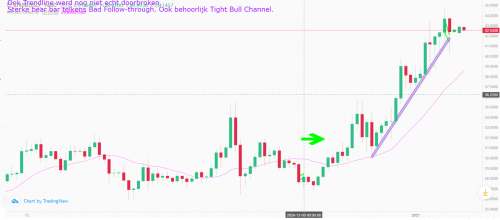
The chart underneath illustrates where I took a LOng position in the crypto-asset BNB. Purely because I thought I recognized Buying Pressure, even though there was no BO yet. Frankly, I didn't follow up for some 2 weeks. Until all the journals strarted publishing Bitcoin -related articles again. Apparently things had started going a little crazy again.
So now I had to deside an exit point. I just have now clue about exitting. I just saw a Wedge Top-pattern forming after 3/4 climaxes. So exitted at about 41,5$. Afterwards, I sax the market continuing, and it went further towords about the 44$-level. But I noticed no regret. I realise now, that if we select the market-interval, which will give us profit more frequently then not. I can't believe how many people I still hear saying "Damn, should have stayed in longer". You've reached your target! Repeat the same action a 1000 times in similar market situations, and you'd have to be one of the unluckiest people of our generation. In other words: it's statistically almost entirely impossible that you'll have a deficit.
The last time I gave an update about the total account equity was 10/26, where I was worth about a 160$.
Latest equity-update:
Yes, indeed. I went from 160$ to about 360$. Do you know what that means?
It can only mean one thing: I was an imbicile.
Important Remark: when I exited the position, I had about 320* equity. Profit made 80$. If price moved about 10$ (31 -> 41), that means that I won or loss 8$, per price-shift of one dollar. If you have difficulties understanding, try this. Suppose I buyed only 1 BNB, at 31$. Should price rise tot 32$, well then my precious BNB is now all of a sudden worth 1 dollar more. From here on, it's not that difficult to see that when you have 8 BNB, you'll have a profit of 8$ if price moves 1 $.
The place where the stop-loss should have come, was at 26$. So with an entry at 31, and an activated stop loss at 26. I lose 8 BNB multiplied by 5$ price movement. 40$ loss, which would have equaled 25% of my total equity. I don't know. Is there anybody who knows Al, and ask him if that falls more or less within the borders of what's exceptable.
Short story short: I risked way to much for one trade. I also didn't install a Stop Loss. I think on the list of biggest trading mistakes, these might be searched for in the higher region.
