The support forum is built with (1) General and FAQ forums for common trading queries received from aspiring and experienced traders, and (2) forums for course video topics. How to Trade Price Action and How to Trade Forex Price Action videos are consolidated into common forums.
Brooks Trading Course social media communities
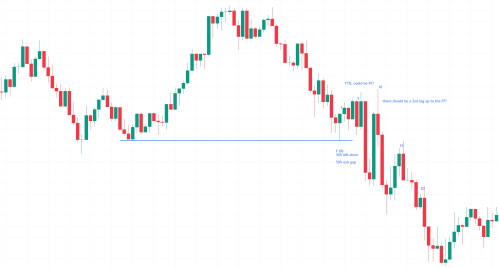
Hi, this is EURUSD on 2022/09/23, 1min chart. (1min fits my lifestyle. I trade 150bars 9:30-12 pm here in Japan)
@ludopuig I'd really appreciate it if you took a look at this topic! Your past analysis on the forum is helping me very much.
Below is what I interpreted from the chart. Bars are indicated by numbers.
1:DB, wedge
2-6: TTR? FF, might get a bear BO and come back
7: strong bear BO below DB, big bar late in trend, but since it's also a BO below TR, 50% chance exhaustion gap and 50% chance MM down.
8: good follow thru
9:strong move back up, telling you 7 was an exhaustion gap? Coming back to the TTR. There should be a 2nd leg up?(TBTL)
10: PB after failed BO at the top of a big down big up TR?
These are only hindsight chart reading. What I did in live trade was selling below 7 and getting out above 9. That's all.
Here is what I'm confused and what I'd like to make clear.
2-6: can they be viewed as TTR and FF?
7:
A. I'm confused about EG and MG. In this case, bar 7 was both EG and MG??? It did lead to a MM down later. But the gap closed early (EG). I used to think a BO could only be either of EG or MG, but can it be both at the same time?
B. Is this a STC? Selling this close, can you avoid a loss at 80% chance , by scaling in? Is this that kind of bar?
9: Is it a good idea to expect a second leg up in this situation?(9 is strong bull and there is a possible FF on the left.) What's the minimum goal for a FF? BO above top of the TTR or 2 legs sideways to up?
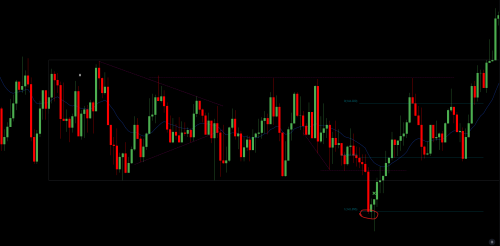
Something more about 7-B :Here is USDJPY from another day. The bear BO was a terrible failure and became a trap. What differentiates this bar from bar 7 of EURUSD chart? Follow thru? (bar 8 was good FT but 9 was terrible)
Hi, this is EURUSD on 2022/09/23, 1min chart. (1min fits my lifestyle. I trade 150bars 9:30-12 pm here in Japan)
The problem with small time frames like the 1 min is that it has many more signals but they fail also many more. You have to be prepared for that.
@ludopuig I'd really appreciate it if you took a look at this topic! Your past analysis on the forum is helping me very much.
Happy to know!
1:DB, wedge
Yes, but tight channel down so better to wait for second entry to buy.
2-6: TTR? FF, might get a bear BO and come back
Yes, because you are low in a TR but still tight channel down.
7: strong bear BO below DB, big bar late in trend, but since it's also a BO below TR, 50% chance exhaustion gap and 50% chance MM down.
It broke below the two former lows and closed near the low, so good BO and it was a BO below a TR, so could be both the end of the leg down, if the BO failed, or the start of a new trend and MM down, if it was successful.
8: good follow thru
Decent FT so now the successful BO premise got stronger and you could sell the close.
9:strong move back up, telling you 7 was an exhaustion gap? Coming back to the TTR. There should be a 2nd leg up?(TBTL)
9 is confusing because it is a surprise bar up after a surprise bar down (the BO). This happens very often in the 1 and 2 min time frame and it is very difficult to handle.
10: PB after failed BO at the top of a big down big up TR?
10 is the BO PB from 7 and higher high DT 6, so it is another entry.
These are only hindsight chart reading. What I did in live trade was selling below 7 and getting out above 9. That's all.
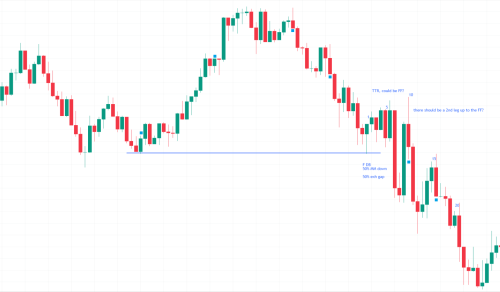
BOs are very difficult because the risk is big and they happen fast so you have little time to react. I would recommend starting with easier trades like second entry reversals or BO PBs, like the ones marked with blue square below.
2-6: can they be viewed as TTR and FF?
They are TTR but not necessarily FF when the channel down is tight. You have to be prepared for anything but this back to back surprises shacked many traders out for sure. In the 5 min, at least in the EMINI that I trade, you get this much less often.
A. I'm confused about EG and MG. In this case, bar 7 was both EG and MG???
No, it has to be one or the other. But...
It did lead to a MM down later. But the gap closed early (EG)
...it not only closed the gap but also went above the BO high, so this was confusing (but usual in 1 and 2 min charts).
B. Is this a STC? Selling this close, can you avoid a loss at 80% chance , by scaling in? Is this that kind of bar?
Not 7 but 8 FT, yes, you can sell the close so you could avoid the loss scaling in but it is not recommended at all because if the BO from a TR fails, the MKT can travel back to the top before going down again, if it goes down. I would not take BOs from TRs until you became profitable because what I said above, and I would focus on the trades I marked in the chart where the risk is contained. If you sell 8C or 8H you have to exit with a loss at 6H and then you can enter again 10L or 16L. Easier said than done....
9: Is it a good idea to expect a second leg up in this situation?(9 is strong bull and there is a possible FF on the left.)
No, the surprise bar up is confusing, so you don't really know, need more info (= bars). Had the bull bar been followed buy another strong bull bar, the BO below the TR would have probably failed and could have gone back to the top of the TR. Instead, you got a DT and BO PB so the failure failed and the MKT kept going down.
What's the minimum goal for a FF? BO above top of the TTR or 2 legs sideways to up?
Both, but in this case you didn't have a FF. It was just another flag. When did you realize this? At 10 BO PB. This is how would have gone:
* 7 and 8 good BO and FT so you expect at least a second leg down and maybe MM.
* 9 surprise bar up so now confusing. BO can still fail.
* 10 went above 5 so it seems EG but then closed near the low, so now likely MG.
In 1 min it went from EG to MG, very difficult to handle in real-time...
Something more about 7-B :Here is USDJPY from another day. The bear BO was a terrible failure and became a trap. What differentiates this bar from bar 7 of EURUSD chart? Follow thru? (bar 8 was good FT but 9 was terrible)
Yes, once you got the bull bar closing on the high all the bears run to the doors. BOs, especially from TRs, have to be very clear or otherwise BO traders will give up. See the last two bars of the chart: It was now breaking above the TR, after the failed attempt to break below, but with good BO and FT, so more likely that the MKT kept going up.
Thanks, @ludopuig for such a detailed reply!
It helped me very much to know how an experienced trader like you would think, because trading is sometimes subjective and I often don't know my opinion is right or not.
The problem with small time frames like the 1 min is that it has many more signals but they fail also many more. You have to be prepared for that.
9 is confusing because it is a surprise bar up after a surprise bar down (the BO). This happens very often in the 1 and 2 min time frame and it is very difficult to handle.
I didn't know that, I just thought 1min is only too fast to trade. I didn't think there are more confusing PAs than in 5mins. No wonder PA traders recommend 5min(or higher).
If you sell 8C or 8H you have to exit with a loss at 6H and then you can enter again 10L or 16L. Easier said than done....
Actually I'm relieved to know that. Some PAs are more difficult than others, and maybe I don't really have to be able to trade all setups (if not just to spot). But I'll have to spot out and trade "blue square" trades like the ones you pointed out.
No, the surprise bar up is confusing, so you don't really know, need more info (= bars). Had the bull bar been followed buy another strong bull bar, the BO below the TR would have probably failed and could have gone back to the top of the TR. Instead, you got a DT and BO PB so the failure failed and the MKT kept going down.
It deepened what I learned from the course and encyclopedia, thank you.
BOs, especially from TRs, have to be very clear or otherwise BO traders will give up.
When Al says "when bulls see this terrible FT, they will try to get out breakeven, or get out below that give up bar..." I always thought "why not give it more time?" but now it's clear. BOs seem more difficult than I thought (especially in 1min).
Dear ludopuig, Thank you again for sparing time for me! And all the valuable knowledge from you!
Hi Y.Y.,
I also trade EURUSD but Asian Session 3m chart.
Beside Ludopuig's already excellent detailed answer, I just want to add that in the FX course Al said that the open for FX isn't exact. It often begins with a strong bar/BO.
In this case, I think bar 7 is the actual start of the session. Looking at PA from bar 7 onward, all previous PAs are drafted. It looks like overnight Globex session PA in the Emini.
If we look at it this way, bar 10 is a double top with bar 7 first bar of the day, opening reverse for a good swing down.
Cheers!
Al said that the open for FX isn't exact. It often begins with a strong bar/BO
Yeah, more complicated than stocks! I actually don't care so much about the open, because you do sometimes get big bars which, in hindsight, does not look like the open. Especially in 1min chart.
Moreover, I think the transition from Asian to European session is easier to see, but that from European to US session is sometimes difficult to see.
But yes, the bear bar you consider as open did occur about 15mins later than the Emini opened.(13:45) So I think it's also reasonable to consider it as the open, and on this particular day, selling below that DT looks easier without any information on the left!
Best wishes, Water Buffalo!


