The support forum is built with (1) General and FAQ forums for common trading queries received from aspiring and experienced traders, and (2) forums for course video topics. How to Trade Price Action and How to Trade Forex Price Action videos are consolidated into common forums.
Brooks Trading Course social media communities
Here Al says:
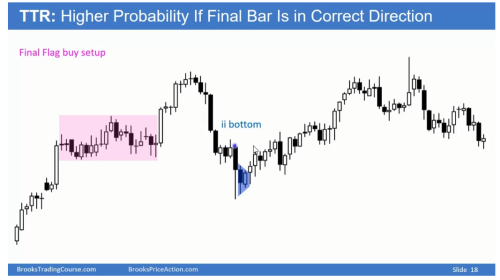
Whenever you have a tight trading range relatively late in a bull trend it often becomes the final bull flag. So you get a breakout and breakout reverses. So, Anytime you see a tight trading range late in a bull trend you always have to be thinking about final bull flag.
My question:
How do I know that this is late in the bull trend? (bars on the left before tight trading range began).
Similarly, How do I know that this is late in the bear trend? (bear bars on the right after the breakout reversed, bars before ii bottom)
How many bars should I be looking on the left to validate that this is late in a bull trend?
If I am viewing this chart as a 5 min chart we have 9 bars forming a bull trend and the tight trading range followed.
If I view this as a 60 min chart we have the same amount of bars on the left.
@ludopuig @Mr. Carpet
Hi Sudeep,
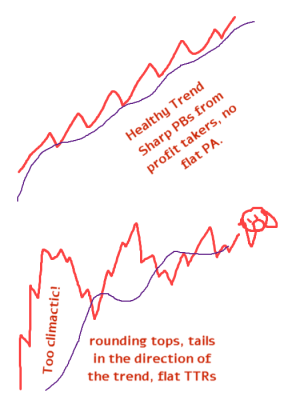
I think the issue with this trend was climactic behavior.
The day opened well with a BO and potential for a trend. But sometimes trends end sooner due to too many climaxes when bulls are just too eager. Especially when climaxes don't have good follow throughs. This slide begins with a BO open (whether it's climactic is hard to tell without seeing yesterday's bars) and then has an even bigger BO bar with bad FT that went flat and Al marked as final flag. It's not 100% that too many climaxes will abort a trend but just something to watch for in general. Sometimes there are two climaxes that actually lead to a small pullback trend but those are low probability of occuring. And usually you can tell that something is climactic when it keeps shooting farther and farther away from the EMA without touching it (not shown in this slide unfortunately) and becoming parabolic.
Basically, climactic behavior reduces chances of a healthy trend. Healthy trends exhibit controlled behavior witout anything too extreme, BOs not too big and not too many, always looking like about to reverse but instead keeps grinding higher.
So on this slide the trend started well but simply ended too soon. It's hard to be prepared for such developments but that's how it is.
To have an idea if bear trend is ending later in the slide you can make use of the whole day's price action. The bear leg went 50% against prior bull trend, making the whole day more likely to become a TRD. So there's a higher chance that the market was entering lower 3rd of what will become TRD so probably it will end soon. You can also see flat TTR a few bars before Al marked the ii bottom. In a healthy trend there are very few TTRs, usually the PBs are sharp due to profit takers, not flat as if there's no one selling or someone limit buying from opposite side.
Hope that helped!
CH
_____________________
BPA Telegram Group


