The support forum is built with (1) General and FAQ forums for common trading queries received from aspiring and experienced traders, and (2) forums for course video topics. How to Trade Price Action and How to Trade Forex Price Action videos are consolidated into common forums.
Brooks Trading Course social media communities
Hello everyone.
I'm not good at English, so please bear with my poor words...
I would like to hear your opinions on this trade.
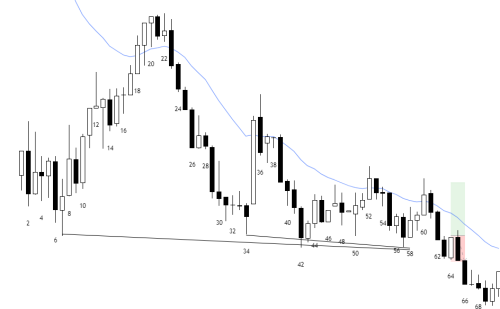
This is today's DAX 5min chart. I bought above B64 for Failed BO below Nested Wedge Bottom. I put SL below B64 and TP on 2x initial risk.
Do you think this is a decent swing setup?
Maybe I'm biased, but I feel like this pattern happens SO MANY TIMES on DAX.
Am I missing something? Too much selling pressure?
Thank you.
I think Al might say 3 good looking bear bars right before so better to wait for a second entry on taking a buy near the bottom of that trading range.
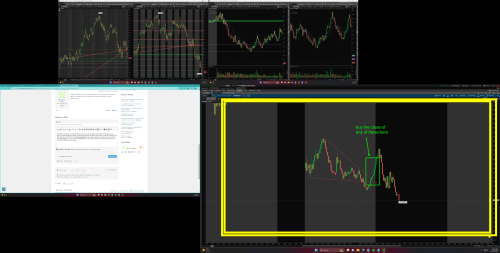
The wedge worked, you just got faked out. It only went slightly lower before turning back up. After you got stopped out what you should have done is look to buy above a bull bar closing on its high after it reclaimed the wedge downtrendline. Those fake break and reclaims are some of the strongest setup. you can see it very quickly turns into a buy the close trend and you would have more than made up your losses.
One last thing i'd like to say. Pay very close attention to recent price action. I was just looking at 5 days of the Dax and i see other wedges that failed as well. So obviously the probability of failure with this wedge would be higher as well. I don't really follow the dax but i follow es and nasdaq and theres a ton of failed wedges and wedge fake outs taking place right now.
(Look below at Image in the yellow box)
I think Al might say 3 good looking bear bars right before so better to wait for a second entry on taking a buy near the bottom of that trading range.
Yeah, I wasn’t paying enough attention to micro things like you said.
Thank you!
The wedge worked, you just got faked out. It only went slightly lower before turning back up. After you got stopped out what you should have done is look to buy above a bull bar closing on its high after it reclaimed the wedge downtrendline. Those fake break and reclaims are some of the strongest setup. you can see it very quickly turns into a buy the close trend and you would have more than made up your losses.
One last thing i'd like to say. Pay very close attention to recent price action. I was just looking at 5 days of the Dax and i see other wedges that failed as well. So obviously the probability of failure with this wedge would be higher as well. I don't really follow the dax but i follow es and nasdaq and theres a ton of failed wedges and wedge fake outs taking place right now.
(Look below at Image in the yellow box)
Very Insightful. Fortunately, I managed to bought the buy the close rally, but I was a little late because I got paralyzed by the fake move down below the wedge. I should have assume this pattern would happen.
In addition, Checking out similar price action of recent days to assess the setup is a total new concept to me. It will be helpful!
Thank You!
I'm sure you've heard how "markets are fractal". An analogy would be if you had a portrait of yourself, and each of the pixels that make up that portrait are just smaller versions of the portrait. A lot of insight into the current days trading and future swing trades can be gained from this.
You have to take all the price action you see and look for clues. Heres an example:
Around the beginning of July, i started noticing wedge top's that would overshoot the trendline and then come break back down through the wedge shortly after on the 1/2 minute /ES. Like everyday they were popping up either at the open or the middle or the close and i was seeing this very consistently and knew i was no coincedence. I then noticed the daily chart was forming this same wedge top and that it would soon rip right down through the wedge. The smaller time frame pattern was telling me what was to come. Then a few weeks later i made the connection that the monthly chart was just one GIANT wedge overshoot, and after a lot of good trades taken off those wedge trendlines, sure enough the monthly chart wedge just cracked. The reason this is helpful is because the smaller time frame patterns are ahead of the larger time frame patterns. So if you can figure out what patterns make up the larger time frame pattern you can get insight into which direction the market is going to go.
Another example is when i start seeing the reversal pattern break of the trendline, retest of the extreme double bottom higher low. there are times where this will show up back to back to back and it's because thats the pattern that the 4hr or daily chart is in the process of fullfillfing.
The market is constantly doing this, most people just don't make the connection because everyday they see all sorts of different patterns and many of them are unrelated.
Pay close attention to the price action because it's not random. It's all linked together and if you look close enough the market will literally give you clues as to whats to come. Al is right, NEWS means absolutely nothing. I believe the market already knows which direction its going before the news comes out.
To improve your timing, look for buying pressure. Do you see strong buying pressure? I don't. Prior to your long entry I see only bars 43-44 with some buying pressure in that entire down trend. Is that enough? It got sold into big time immediately. Bulls barely made it to the MA, then more selling.
Just because it's a wedge and nested wedge, doesn't mean it's going to reverse right now.
Also:
After the bull trap at 35, you have to be suspicious of any reversal attempts by bulls. May be they aren't really very strong after all?
i personally see a wedge top attempt from bulls which fade out at EMA.
Everytime bulls touch EMA they're reverted down. There's not 1 MAG bar and we are AIS up to your entry. You need at least one strong close above the EMA and good continuation to challenge that selling pressure.
From b7 to b32 it seems you have a V top pattern. b35 is an attempt from bull to reverse the bear BO. Since it fails at EMA you have now a LH MTR at b36.
Bears take full control of the market and bring prices down.
I appreciate all the great advice!
Your answers definetely improve my trading, for not only this setup, but also other areas which I was doubtful about.
Thank you guys!
Hi,
consider to take a look on the 15m chart as well and ask yourself if you would like to buy at the place? This might help you to determine where the PA is at that moment to avoid front running it helps to take 2nd entries as well.


