The support forum is built with (1) General and FAQ forums for common trading queries received from aspiring and experienced traders, and (2) forums for course video topics. How to Trade Price Action and How to Trade Forex Price Action videos are consolidated into common forums.
Brooks Trading Course social media communities
Hello,
I'm trading the FTSE index and the chart today has the pattern which can be seen in the screenshot. There is a Spike up on the open (which is 09:00 on this 5 min chart), after which there is a deep PB and the market forms a fairly large Triangle. There is a Bull BO of this Triangle, after which there is a small PB Bull Trend to the HOTD. The red line is a simple MA.
My question is: what is the estimated probability of a successful above the HOTD (and therefore the TR)? I'm aware that 80% of BOs of TR fail, but 80% of reversals in small PB trends also fail and this small PB trend lasts quite some time. Is it the bigger pattern (here the TR) which is more decisive? Or is it more of a 50/50 situation, as the small PB trend is also a Second Leg up within this TR etc.?
Thanks in advance!
With the strength of the BO the MKT should reach some kind of MM, either measuring the height of the BO or a Leg1 = leg 2 move. The two big bear bars at the right of the chart are at the same time a BO test but also a sign that the SPBL trend is weakening and a TR is developing.
Thanks for the response ludopuig. If I'm understanding you correctly, I should determine which one continues (either the TR or the small PB Bull Trend) by the strength of the BO of the TR?
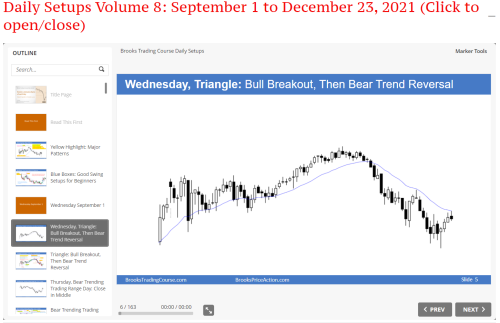
Sadly not that easy, is the whole chart that tells you one thing or the other. In this case, the strong 4 bar COH BO and the BO of the triangle becoming a SPBL allows you to expect some kind of MM so you can hold long because even if at the end the MKT can't break above the TR, in SPBL trends the first reversal usually is minor. The best thing to study this situation is going to the encyclopedia where you have many charts having BOs from triangles, both succesful and failed. Also you can see the daily setups, I remember a similar day (1st septemtber):
You can see the difference: no prior strength (strong BO leading to the triangle) and the SPBL had no consecutive bull bars so it was not going to last all day. There you actually got the reversal. As I said, there are more examples in the encyclopedia.
Thanks again for the detailed response! I'll look into the encyclopedia.

