The support forum is built with (1) General and FAQ forums for common trading queries received from aspiring and experienced traders, and (2) forums for course video topics. How to Trade Price Action and How to Trade Forex Price Action videos are consolidated into common forums.
Brooks Trading Course social media communities
If a setup has a 60% of giving a profit this means that it loses 40% of the time...
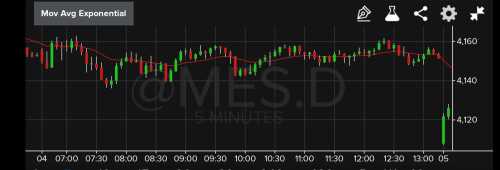
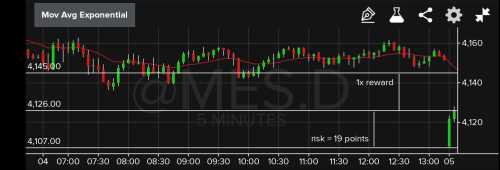
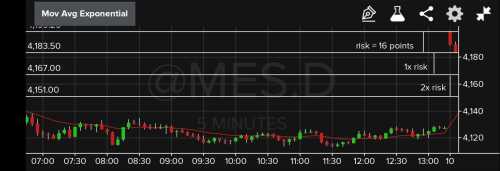
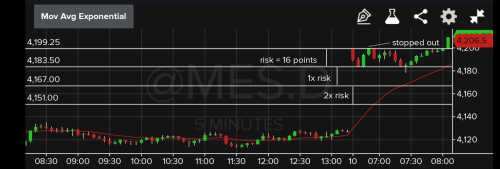
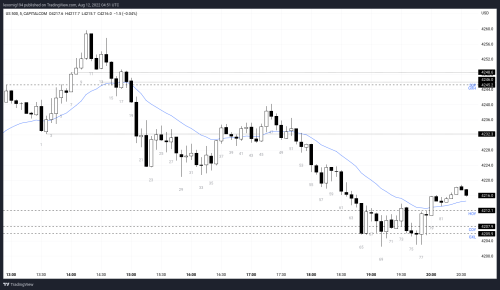
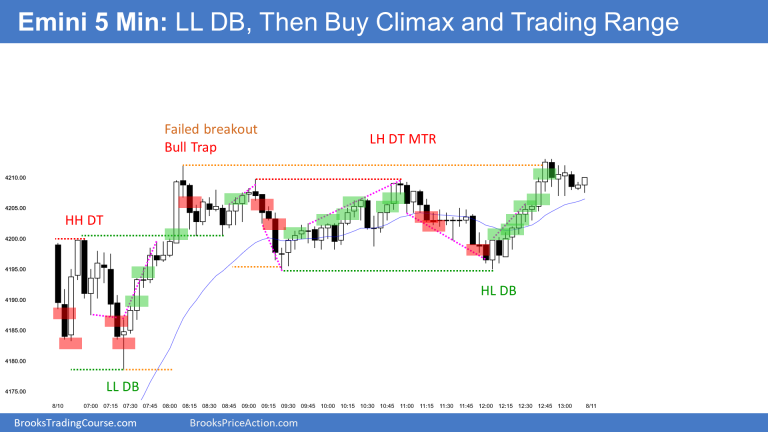
Any reason why trade setup #2 (sell the close bar 2) is a bad sell?
I found bar#2 was the BO bar below August 8 prior high (seen in picture), so maybe should wait for bar 3 follow thru?
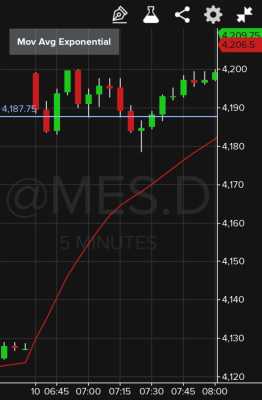
... After waiting, realize TR, until DB reversal Bar11, or 12-13 BO + follow thru.
Any reason trade setup#1 is bad?
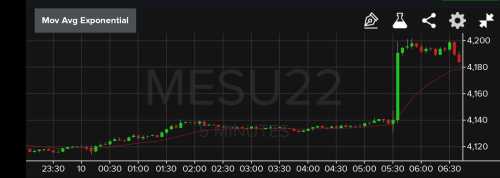
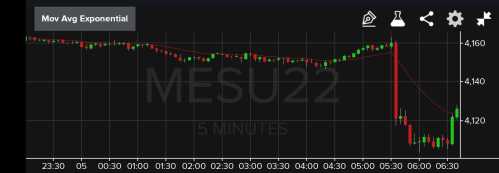
Finally, combining the similarities: Both setups start with a prior TR, then major opening gap in opposite direction before 2 consecutive big Bars reversing the gap. Are there good/bad warning signs?
In his book, Mr. Brooks wrote
Since most trades are only 60 percent certain at best, you always have to have a plan for that other 40 percent of the time when the trade does not do what you expect. You should not ignore that 40 percent any more than you should dismiss someone 30 yards away who is shooting at you but who has only a 40 percent chance of hitting you. Forty percent is very real and dangerous...
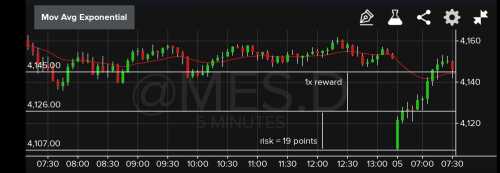
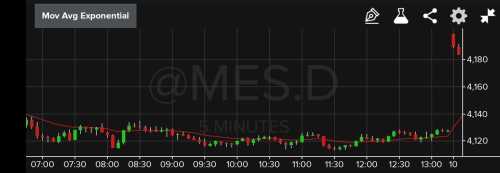
I've just stumbled upon another example of similar best trades but different results:
2022-08-11:
outcome:
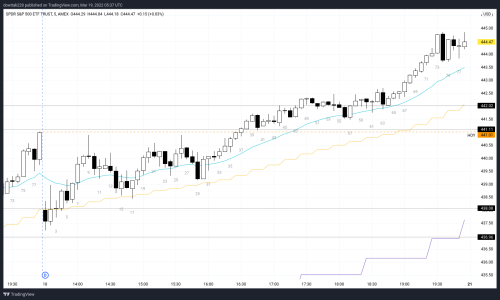
2022-03-18:
outcome:
In the daily setups for 8/10 (the sell+loss example that I posted) Dr. Brooks shows sell the L on the first 2 bars (I was thinking sell the close). So I think it indicates reasonable trades, 40%-60% chance of a loss- which happened.
Few concerns:
Bar 2 was the BO below 8/8 high, so should traders wait for a follow thru bar, confirming the BO
After seeing bar 3, should traders exit for a smaller loss
After a huge gap up, is that a good idea to sell (the opposite worked in example 1 from 8/5)
Hi Both. It might be helpful to review Video 49F - Swing Trading Examples. Which covers Daily chart context.
It is important to trust the price action on the chart your trading on and try not to let higher timeframes bias you too much... but at the same time it helps to have a general awareness of what the daily chart is doing.
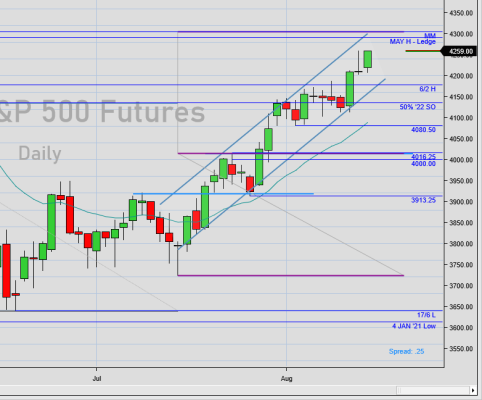
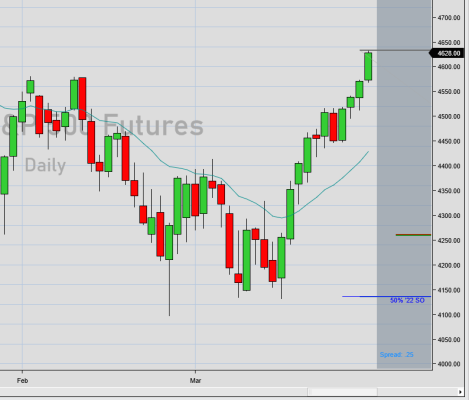
For example, we are currently in a tight bull channel on the daily chart:
So you should be expecting many Bull days, but also pauses and occasional bear days and sideways days. You should also expect significant sell-offs and bearish economic news to be bought. Whereas highly bullish economic news would not be expected to be sold aggressively in the same way.
@W I think this explains why your examples look like mirror image setups, but the behaviour was different.
@Water Buffalo I remember the mid-march period, it was a great time to trade on ES. The market rallied 400 points over 14 days from an FOMC announcement. It was a buy-the-close market/bull micro channel on the daily. (oh how I miss those days):
So while the tight bull channel of the last month is extremely bullish, its not as bullish as a Buy-the-close / micro-channel like we saw in March.
Try not to let higher timeframes bias you too much. You should trust the price action on the 5 minute. There is a real risk of "analysis paralysis" if you look at multiple timeframes. But as Al teaches in 49F, its good to have a general awareness of what the daily chart is doing. It does explain the differences in behaviour you are observing with the examples you've shown.
A few of my notes from video 19A:
- It is common for trends to be different depending upon which time frame you are looking at. IE: Monthly chart = bull channel; Weekly chart = TR; Daily chart = 3 bear bars in a row; 5-min chart = buy the close bull trend.
- Trade one time frame and base those stops and PTs accordingly.
A few quotes from Al in 19A:
"Any move on 5m chart can be caused by tests of S/R on other time frames"
"Signals on higher time frame charts are infrequent"
"Most moves are due to S/R on the chart in front of you" (Far more signals on 5m chart in front of you than on other charts)
"Don't worry about other charts"
That said... Al plots the 1-hr 20MA and the 15-min 20MA on his 5-min chart. So, he's referencing a couple of higher time frame indicators while trading. There is no discussion in the course that I could find as to how he uses those. However, occasionally (in the webinar), he will look at and discuss higher time frame charts directly. Not for their moving averages, but for previous OHLC (as discussed in video 19C).
Looking at your pictures above (very first screenshot), if you notice in your 2nd trade where you were stopped out, you're shorting on a gap up above the MA, the other thing I would say is immediately after bar 2 (bear bar closing on low) bad follow thru, at that point I'm either getting out or waiting on more price action to trade. Also remember generally you can expect 3-5 reversals 3-4 days out of the week on any given day before a trade picks a direction.
You also had the double bottom a few bars later, if I see that I'm reversing to long. I always draw a horizontal line for yesterdays high/low and use that to gauge where price action could test as well. Hope this helps.
One other piece that really helps me more than anything is Gaps. Look at you your first trade, if you look at your first big bull bar and the third bar, you basically have a negative gap that never got filled = strong bullish action.
In your gap up bear reversal bar, gap immediately filled on bar #3
That said... Al plots the 1-hr 20MA and the 15-min 20MA on his 5-min chart. So, he's referencing a couple of higher time frame indicators while trading. There is no discussion in the course that I could find as to how he uses those.
49F has some usage of the 60min 20ema on the 5 min chart.
