The support forum is built with (1) General and FAQ forums for common trading queries received from aspiring and experienced traders, and (2) forums for course video topics. How to Trade Price Action and How to Trade Forex Price Action videos are consolidated into common forums.
Brooks Trading Course social media communities
Al says,
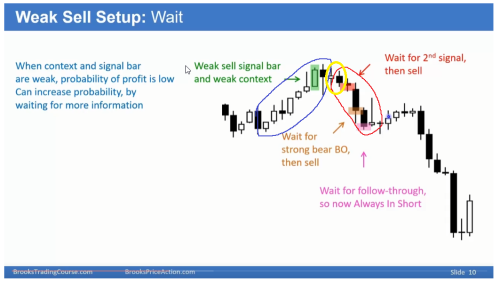
Here we are rallying (Bars enclosed by the blue circle). we have 4 consecutive bull bars, a 7 bar bull micro channel. Here the context to short is bad (which I agree). So instead of selling under the weak signal bar (bull bar highlighted green by AL) sell below the ii (circled yellow).
My question:
What is the thought process to sell it below the ii here (the second signal)(bars circled yellow)? Is it just because it is an ii pattern and is in a breakout mode?
Also, Since AL describes the rally as a 7 bar bull micro channel (bar enclosed in blue circle), can't the ii pattern here just be a pullback or pause and trend resumption up is also a probability/likely?
Al also describes the bars enclosed in red circle has a strong enough selling, so probably a bear flag and another leg down. But this is also true with the 7 bar bull micro channel. Why is that not strong enough buying, so probbaly a bull flag and another leg up?
I can make sense of selling the bear flag after seeing the bars (enclosed in red circle) since it pulled back more than 50% of the prior micro 7 bar bull micro channel and the trend is weakening. But even then that bear flag could be a bottom portion of the developing trading range. And going short at the bottom of the trading range is also a low probability trade.
Hi Sudeep,
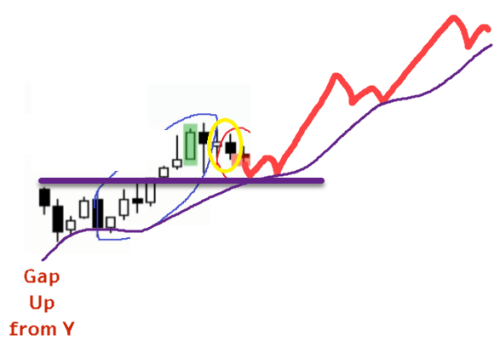
I think in real time Al would have had other reasons to sell below that ii than just because it's ii. We don't know how this price action is relative to prior day, maybe it opened with big gap up, tested EMA and was going to keep breaking higher strongly.
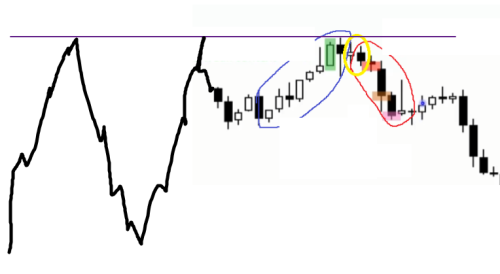
But maybe prior PA was trading range and this was a test of double top / wedge and so on so better to sell:
I think the purpose of this slide is just to say "if you're looking for a sell, then better take a 2nd entry, don't sell when bulls look strong like this".
Hope that helped!
CH
_______________
BPA Telegram Group
I think the purpose of this slide is just to say "if you're looking for a sell, then better take a 2nd entry, don't sell when bulls look strong like this".
If I consider the two scenarios you provided it makes sense. Here in this chart when AL said weak context I was considering that bull channel as a context. But yes, if the day before or prior days have a bear trend then this could also simply be a pullback in a bear trend and it makes more sense to sell, or the trading range example you mentioned.
Thanks Again!! Really appreciate it.


