The support forum is built with (1) General and FAQ forums for common trading queries received from aspiring and experienced traders, and (2) forums for course video topics. How to Trade Price Action and How to Trade Forex Price Action videos are consolidated into common forums.
Brooks Trading Course social media communities
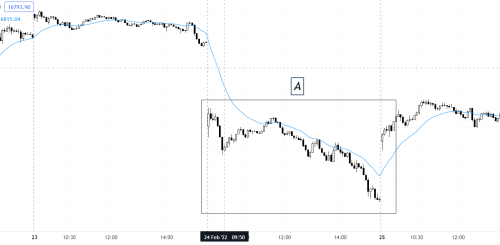
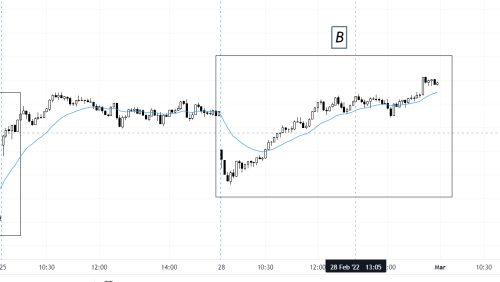
As you can see from the above pictures:
- Day A gapped down trended down for 3 bars, tested the top and trended down into the close, whereas
- Day B also gapped Down followed by a couple of strong bears bars but instead kept trending up into the close once it reversed.
Why did the Price action unfolded the way it did on both the days and is there any way one can anticipate it or trade it in general? The ticker is Nifty 50 Index on NSE.
I have completed the Price Action Fundamentals part and am currently reviewing the material using Live charts before moving on further.
Watch the trading the open videos in the how to trade part of the course where you will see that those pattterns are common in the open. You can also check the encyclopedia where you have a a lot of more charts with similar patterns.
If I might add to what ludopuig said, only 50% of the opening breakouts sustain and the rest get reversed. In addition, on just 20% days does the opening high/low goes on to become the high/low of the day. Take that and the other relevant factors into account and you might start to understand the market structure a bit more clearly.
Also, I am going through the fundamentals part once again although I finished it quite a while ago and I see there are tons of information I missed out on. I have seen other people say the same too. Odds are, you could have missed something as well and you'd be better placed if you go through the material once again.


