The support forum is built with (1) General and FAQ forums for common trading queries received from aspiring and experienced traders, and (2) forums for course video topics. How to Trade Price Action and How to Trade Forex Price Action videos are consolidated into common forums.
Brooks Trading Course social media communities
Hi all!
So far, the only type of MA I've know are 'day'.
Al talks about 'bar' and 'minute' MA. I'm a bit confused with that.
Whatever search I do on the Web talks about 'number of day' MA.
Can you tell me more about that subject and where can I find those 'bar' MA for instance. I don't see this anywhere in the platforms I'm using.
Thank you!
Hi Denis!
An MA can be calculated based off any chart timeframe (5 minutes, 1hour, 1 day etc.). This means, that a 5 minute, 20 period MA will calculate the average price for the last 20 bars = 100 minutes.
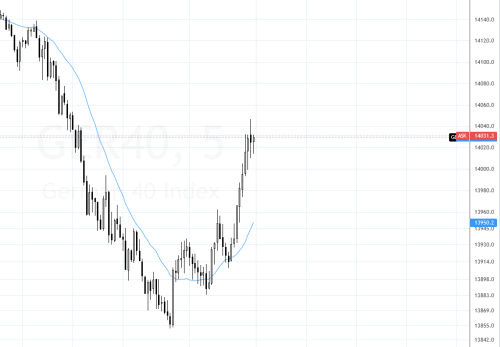
The "bar" simply refers to the lookback period. A 10 period (=bar) MA will base the average on the last 10 closes, a 50 period MA will base the calculation on the last 50 closes. The picture below shows a 20 period MA applied to a 5 minute chart.
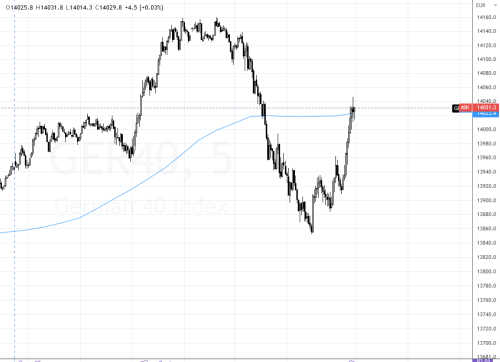
Additionally, you can also plot the MA from a different timeframe onto the chart. For example, 5 Minute chart can have the 60 Minute, 20 bar MA plotted:
I'm sure most platforms have MAs included. Certainly, the metatraders platforms and tradingview have them.
Hope this helps!
Regards,
Kristof
Thank you Kristof!
What confuses me is that whenever I read about MA, it says that the calculation is based on days.
https://www.investopedia.com/terms/m/movingaverage.asp
- A simple moving average (SMA) is a calculation that takes the arithmetic mean of a given set of prices over the specific number of days in the past; for example, over the previous 15, 30, 100, or 200 days.
So when Al says for instance 'twenty bar MA' I get confused, since there's no 'day' word. You see what I mean?
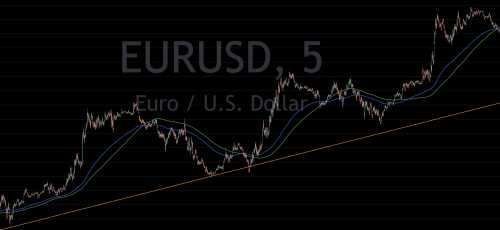
The MA is based on whatever timeframe you're looking at. For example, if you are on a 5-minute bar chart, a 20 moving average is based on the past 20 5-minute bars. If you are looking at a day chart the moving average would then be based on the bars on the day chart. Although, where it might get confusing, you can have different time frame moving averages on different charts. I personally have a 60-minute 20MA on my 5-minute chart while I'm trading futures.
Hope that helps!
Thank you Jeffrey!
It's quite simple, but I've never realized how it works precisely.
I've never seen that kind of option anywhere though (60-minute 20MA on a 5-minute chart). What platform are you using?
Hi Denis,
applying a 60 minute 20MA on a five minute chart is possible for example in the tradingview platform.
Glad we could help! Personally, I like to use the 60-minute EMA to judge the trend on a longer timeframe. For example, I'm trading the 5 minute chart and the EMA shows me the big picture of what's going on on the hourly chart.
But a lot of times I'm not even using the moving averages, just a blank chart.
Denis,
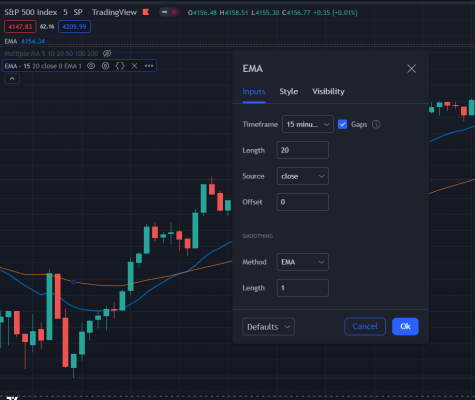
This is what you want to see when you select one of the (many available) Moving Averages, a configuration where you can manually select the time-frame you want to see (regardless of the actual time chart you are in):
There's a lot of different Moving Averages in Tradingview: SMA, EMA, WMA, etc. For a smaller time-frame I use the EMA (which gives more weight/importance to the last couple of bars, as opposed to a SMA which does not make that distinction).
Use the Indicator called "Exponential Moving Average (Updated)"
Be aware that this particular indicator let you select only one line. Add another one to use as your 20 EMA based on your "chart" timeframe (be it 5, 15, 60 minutes or what you have). See the snippet attached.
All best and have fun!


