The support forum is built with (1) General and FAQ forums for common trading queries received from aspiring and experienced traders, and (2) forums for course video topics. How to Trade Price Action and How to Trade Forex Price Action videos are consolidated into common forums.
Brooks Trading Course social media communities
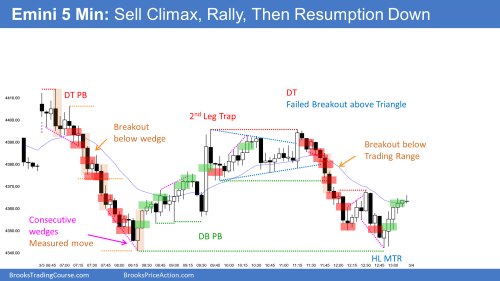
Today, I was looking for a resumption of the bear trend after a wedge bear flag pullback. It looked like it was about to turn down for a little bit on bars 35 and 36, and then there was a big bull surprise bar. Am I correct calling it a surprise bar? Luckily, I got out of my short when I saw it reversing up for a small profit. What did I miss that would have told me there were no good sell signals on bars 35 or 36? I noticed Al had not marked any sell signals on his chart in this area.
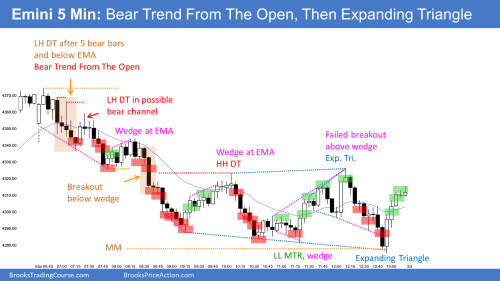
On March 1st, there was a similar wedge pullback that resumed down. I know that the pullback on March 1st happened at a later time in the day, and the morning looked a bit different. I'm looking for insight on why it was potentially lower probability than I thought - selling after bar 35 today, March 3rd. What were some key differences between the March 1st wedge pullback and today's? Was it because a strong measure move was already hit today before the pullback? Was it the time of day? The strength of the move up, or that today had a double bottom bull flag inside the move up on bar 30? A combination of all of these things? Attached are Al's charts of today and March 1st. Thanks in advance for any help.
I have the same question as well. Bar 29 was L2 and at moving average so thought was reasonable sell setup, and bars 33 and 34 turned down around 50% PB. I never saw big bull bar coming after such a tight bear channel so likely was a surprise bar (after the surprise bar was expecting some kind of MM). Not sure why it is a second leg trap as high of the day was still far, unless I am missing anything? Thanks!
Maybe because it was a first entry and doji with tails on both side?
On the 2nd chart it was the 1st entry and tails on both side similar to the 1st entry on the 1st chart.
Am I correct calling it a surprise bar?
Yes! A bar 3 or more times bigger than the preceeding ones is a surprise.
What did I miss that would have told me there were no good sell signals on bars 35 or 36?
The MKT was in a swing up after a good bottom so you should be looking to buy. See below why.
On March 1st, there was a similar wedge pullback that resumed down
Not really similar. In one chart the MKT had already reversed while in the other was still in the swing down.
What were some key differences between the March 1st wedge pullback and today's?
Here the differences:
The MKT broke below March 1st Wedge 16 so you should expect two legs down to a MM. The move down to 31 was probably only the first leg (no bull bars at all, no buying pressure) and it was so strong that the first reversal was probably going to be minor and become the PB following the second leg down that could reach the MM. Once the PB started at 33, it lacked consecutive bull bars other than the first two, there were tails and it was stalling at EMA (no closes far from EMA, no bar with low above EMA) and 50% PB, where many PBs end.
Compare now with March 3rd: The MKT also broke below a Wedge 9 but at 22 it had gone far below the MM and created consecutive bottoms with a great SB followed by 3 bull bars, some of them closing on the high. When you have a good swing setup (good context: consecutive bottoms, and good SB) and it is followed by consecutive bull bars, this means the MKT has reversed and shorts are traps from there onwards. Also, 28 was a L2 but had a tail and compare with the bull bars that were surrounding it, there were many closing on the high so the buying pressure was much stronger than the selling pressure, another reason to suspect. Finally, 32 was the 4th bull bar and it closed far from the EMA, the bar preceeding it also closed on the high and the next one, 35, even tho a doji, was another bull bar closing well above the EMA. 34 was a Wedge but the SB was a doji after 5 bull bars so bulls could exit below or at 35C if they could buy again later or, alternatively, hold with stop-loss still below the SB, 22L, but bears couldn't sell (LP), the MKT was going up.
I have the same question as well. Bar 29 was L2 and at moving average so thought was reasonable sell setup
For what I said above, this was actually a trap that many times occurs when the MKT has turned up to trap bears. If you are an encyclopedia subscriber, go to the traps section and you will see other charts with similar traps, they are fairly common.
Not sure why it is a second leg trap as high of the day was still far
When you have a BO that is a second leg up, 37, and it is much stronger than the first (here the move up to 35), and you are still below prior highs, if you get a good reversal bar probably is a second leg trap. Here it was a little more difficult because 38 didn't close on the low and had weak FT, and one bar before, 37, bears had been trapped so, yes, 2nd leg trap, but not strong... Yet, it is a good idea to exit longs below 38, especially if you have a good swing profit, and reassess.


