The support forum is built with (1) General and FAQ forums for common trading queries received from aspiring and experienced traders, and (2) forums for course video topics. How to Trade Price Action and How to Trade Forex Price Action videos are consolidated into common forums.
Brooks Trading Course social media communities
Hi, everyone!
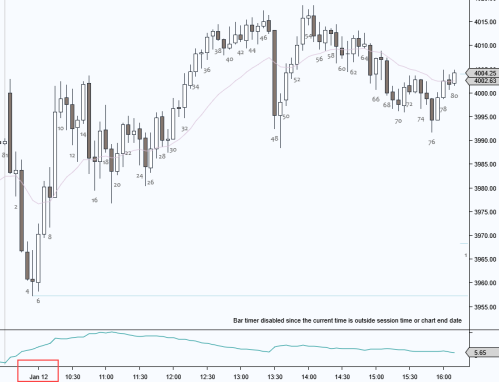
I have a question about the day 01/13/23 and maybe someone can help me. Since now thank you for your time.
I trade the market since bar 1 until bar 22 because after i have another appointment, anyway..
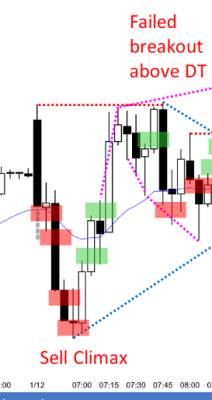
I would like to know if what I seen is wrong: bar 1 - 4 was a sell clx and 6 - 10 another clx, but in this case was buy clx. after moves big up - big down like that on the open I look for reversals and fail breakout because i assume 'big up big down - big confusion'. I don't expect the market formed a bull trend, like formed today and was expecting a test at the high of bar 5 and a fail breakout to the bottom of 6.
I would like to know if we have any signals that show us that a trend is more likely than:
- open bullish microgap from bar 5 high and bar 6 negative gap;
- failure on the sellers' second entry (bar 16) to take the market down;
And one last thing, I understand the reason to buy above bar 13, it's a H1 after a strong breakout from bar 9-10, but wouldn't that be a short limited entry at the high of the range? By the time we formed the buy mark above bar 13, the market had not shown the sellers' failures and for me it was still likely that a TR would follow. Also a stop would be below bar 6, a bad trader's equation for me, hoping the breakout would work into a range.
I couldn't understand what I missed. Every trend bar is momentum, breakout, climax and gap, but in context to me this bar 9-10 high looked more like a second leg trap.
Perhaps my thinking is correct for an assumption that is more likely to happen, but since nothing is 100% in trading, the market can do the exact opposite of what we are expecting.
Att,
Hi Felipe
The two clearest events in my thoughts during the opening 20 bars was the climactic low confirmed at the bar 6 strong bull bar, and the failure of the bulls to penetrate the double top (at bars 11-18) at the big round number.
yes!!
Al actually marked 15 and 18 as reasonable swing sells, so your thinking was ok. It was very likely to be a TR after BDBU and DT 1,10 FBO. But there was something wrong with the bears:
1. 5L couldn't close a gap with previous day's B20.
2. Strong bear moves in a TR often have sellers waiting at 50% PBs anticipating a 2nd leg down because TRs often have at least 2 to 3 legs up and down. Bears tried to sell 50% PB during bar 8 but were quickly overwhelmed. Suspicious.
3. Bar 15 couldn't close below prior swing low 13. Then 16 couldn't close below 15. Then 19 couldn't close below 16. Now it's a wedge 13,15,19 at 50% PB for the bulls and Al marked 20 a buy anticipating a 2nd leg up attempt.
4. Al did mark 22 as a sell though. Bears had one more chance because in TRs wedge bull flags near highs often fail strongly to the downside as 2LT.
5. All of this was happening at the moving average also. So bears were really not doing what they were supposed to: no strong cc bars, getting stuck at MA, wedging, etc.
Were there hints that a bull trend was coming? Not too many. Maybe if there was a very strong BO above HOD with FT (like 33,34), then test down to BOP and create a gap or body gap (48 killed that dream for bulls though).
----
Regarding B13 buy:
1) It was a weak PB from Bar 10 with bars not closing below prior bars.
2) It tested a gap with 8H and MA.
3) After such strong 6-10 there was expectation of at least 1 more leg up.
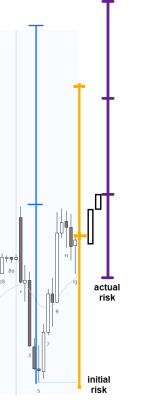
In terms of risk: if there was a strong BO+FT to the upside, can expect 60% chance or better of MMU 1-5 so buying above 13 and risking initially LOD it fits into that 1:1 distance. Or, if tightening to actual risk and going for 1:2 almost fits as well depending how it actually turns out. So buys like this near top of TR are not meant for scalps (although often turn into after disappointing FT) but try to anticipate a huge breakout and a big move up for 1:2 or better of the whole day, otherwise traders quickly exit and possibly even reverse for a scalp down if the market is confirming that TR is still on.
Thank you very much!
Your responses were very valuable, I am still reviewing that day and I will take your observations into my notes.
Again, thank you very much!
after moves big up - big down like that on the open I look for reversals and fail breakout because i assume 'big up big down - big confusion'
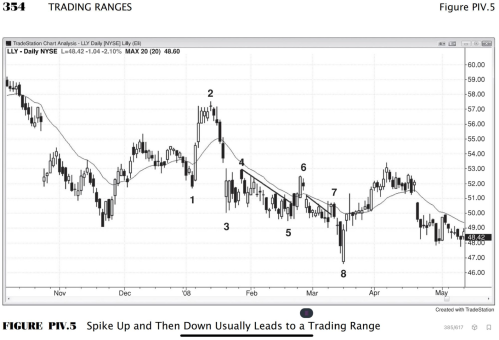
I think you're correct in expecting Trading Range after big up - big down. Here is what Al said in the book Trading Range:
Whenever the market has a spike up and then a spike down, or vice versa, it tends to enter a trading range as the bulls and bears both fight to create follow-through in their direction
But let looks at the example provided for that statement:
A sharp move up and then down, like the move up to bar 2 and then down, is a climactic reversal and a two-bar reversal on some higher time frame chart. It is a single reversal bar on an even higher time frame chart. Bar 8 was a sell climax and a two-bar reversal, and the move would be a single reversal bar on some higher time frame chart. It was followed by a trading range, which grew into a bull channel.
To me, that looks just like the day in question just inverse.
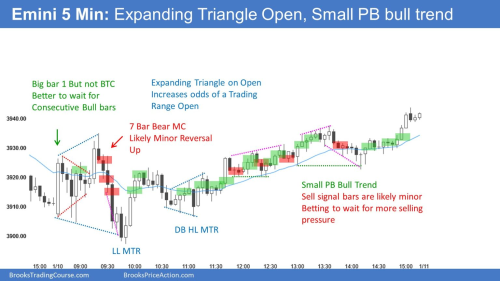
This is another example with spike down (7 Bar Bear MC) spike up, bull channel:
