The support forum is built with (1) General and FAQ forums for common trading queries received from aspiring and experienced traders, and (2) forums for course video topics. How to Trade Price Action and How to Trade Forex Price Action videos are consolidated into common forums.
Brooks Trading Course social media communities
I'm a little confused about when to trade climactic reversals and when not to.
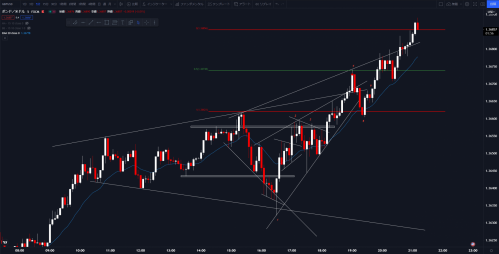
Below is the chart I encountered today. (GBPUSD 5min)
I saw the biggest bar in the last 10 bars or so (bar 4), which broke above an expanding triangle and also a wedge. I sold at the market at the close of it. I put the stop at the measured move and expected it to test the BO point. It actually did (bar 5), but didn't go down any further.
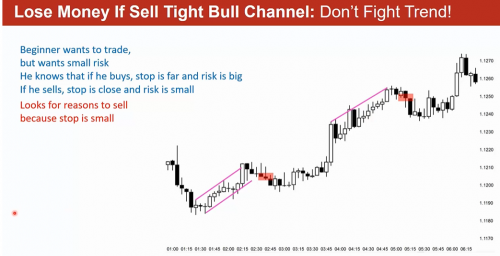
First, is it acceptable to go against such a tight trend even if you see an ET and a climactic bar?
Second, if it is, is it only as a scalp? Does the fact that you are selling in a tight bull channel reduce the probability of BO downside?
Third, can you interpret bar 6 as H2 bull flag and buy above the close of it? (the price is still in ET and just a few bars after a climactic move, so I felt reluctant of buying)
Thank you in advance.
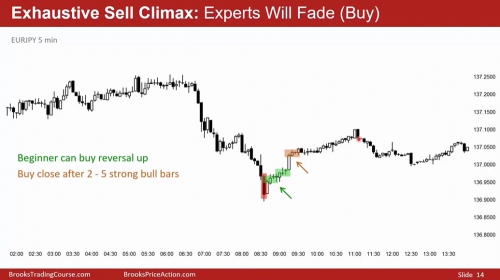
Looking at Al's two images, there are at least 2 differences:
1. 43A doesnt have convincing climax bars
2. 42A waits for multiple good reversal bars, and after the convincing climax.
Looking at Al's two images, there are at least 2 differences:
1. 43A doesnt have convincing climax bars
2. 42A waits for multiple good reversal bars, and after the convincing climax.
Thank you for your reply.
I guess I had misunderstandings about climaxes. As stated in the picture above, climaxes don't mean immediate reversals. I was amazed by dynamic trades like 42A, but those might be rare, and only for experts who can scale in. I now know climaxes usually just mean that you should be careful if you follow the trend.
First, is it acceptable to go against such a tight trend even if you see an ET and a climactic bar?
Al mentions in the videos, that if the context is good for a counter-trend trade(which is usually confirmed by weakening of trend previously in some manner), one can take the 2nd entry buy or sell(after a tight channel) as it has a higher probability of success.
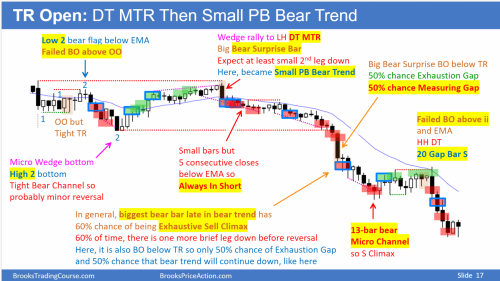
I can recall at least two instances where taking a counter-trend entry is fine - first being a strong and maybe even climactic 2nd leg in a trading range and the second one being in case of climaxes(maybe a parabolic wedge) late in a bull trend or a climactic breakout that you suspect is probably an exhaustion gap and not a measuring gap(late in a trend 20 or more bars in).
In the case of latter though, it does not mean end of the trend and can result in just a pullback or trading range where the exhaustion gap is expected to be filled.
Just wanted to add my thoughts if that helps somehow.
Best regards.
I appreciate your reply, Abir. As you have said, it is probably important to find sufficient reasons like second legs for reversal. Being at the top of ET might not be good enough. Now it doesn't look like the price is in TR especially because of the BO upside.(first chart)
I now noticed that 42A has a very good risk reward, (the reward is large because the 2nd leg was very long) and that might also be a reason that makes the buy acceptable. In the first and second chart, the climax bar is not so big, and reward might be too small to make profitable trades.
Anyway, I should probably look at more charts to improve the decision.
Thank you!
I should probably look at more charts to improve the decision
Probably the only way to get better.
A climax is a setup. You are looking for 2 of the last 3 bars as strong with-trend bars, Followed by multiple good reversal bars.
If the climax setup is there, the risk/reward is always good because price climaxed (strongly), and the reversal (with multiple good counter-trend bars) gives you good enough probability. A satisfactory traders equation is achieved.


