The support forum is built with (1) General and FAQ forums for common trading queries received from aspiring and experienced traders, and (2) forums for course video topics. How to Trade Price Action and How to Trade Forex Price Action videos are consolidated into common forums.
Brooks Trading Course social media communities
Hi,
I realise that the differences are often very subtle, and that's exactly why it takes so much time to learn.
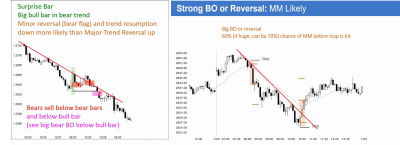
But for example, in mentioned video (15H), in slide 3 on the right hand side (USDCAD): surprise bull BO will probably be minor because of tight bear channel prior to the bull BO-bar.
But in slide 4. There's a bull BO out of a Bear trend. I would bet that if we where to look on a slightly higher time frame, the Bear trend would have a pretty tight look also, and the Bull BO would only be one or two bars, instead of the 3 bars. So it would look pretty similar to the situation in slide 3. Yet in slide 3 it's a low probability bet to buy, and in slide 4 it's a high probability bet to buy.
What am I missing here?
Thanks in advance
Marvin
When a channel is tight, the first reversal is probably minor so at the SB high, both trades are low probability (every reversal pattern is low probability, despite how good it looks, like the wedge on slide 4).
Now the differences: in slide 4 you got a good SB followed by 2 consecutive bull bars closing near the high, this is what turned the probability in favor of the bulls, and made 60% likely the MM would be reached. Not before. Rather, on slide 3 you have a terrible SB, and then a bull bar but with terrible Follow-thru: this is a PB, not a reversal.
Summary: in slide 4, the minor reversal turned into a major reversal while on slide 3 the reversal failed and turned out to be a PB.
All right. My idea was that when you would compress the chart in slide 4, it would show pretty much the same pattern as in chart 3, so you would also only have 1 BO-bar (instead of 3), and no follow-through (yet), should you compress the chart of slide 4. But even if you were to compress that chart
, the FT would have been a fact eventually.
I also thought that the bear channel on slide 4 counted many more bars, than the one on slide 3 (which was the reason for me to compress the chart, so they could be better compared). But I actually counted the bars, and as it turns out, they both had approximately 25 bars. So the bear channel in slide 3 is indeed much tighter/stronger.
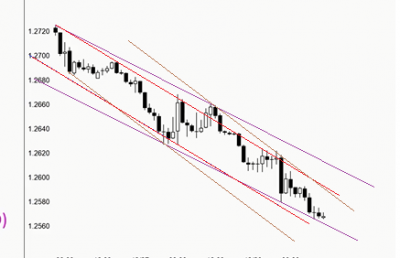
I also drew trend lines above both channels (see attachment), and the trend line in the chart on slide 4 was clearly broken with Follow-through. Whereas the trend line on slide 3 was hardly broken (close below trend line), and had very bad FT (in fact reversal bar).
Are these personal reasonings of mine correct?
@marvinbertonyahoo-co-uk
My idea was that when you would compress the chart in slide 4, it would show pretty much the same pattern as in chart 3, so you would also only have 1 BO-bar (instead of 3), and no follow-through (yet), should you compress the chart of slide 4. But even if you were to compress that chart, the FT would have been a fact eventually.
Zooming in and out will bring you more confusion than help. What you are saying for this situation is valid for any situation: a 3 bar BO in your time frame is a 1 bar BO in the higher time frame and a 6 bar BO in the lower time frame. This doesn't help you: instead, you should analyse the chart in front of you as it is and base your decision on it.
But I actually counted the bars, and as it turns out, they both had approximately 25 bars
The number of bars is not something to use for a comparison. You should focus in patterns, and they can have 10, 20 or whatever bars. The important thing is the pattern within the given context.
I also drew trend lines above both channels (see attachment), and the trend line in the chart on slide 4 was clearly broken with Follow-through. Whereas the trend line on slide 3 was hardly broken (close below trend line), and had very bad FT (in fact reversal bar).
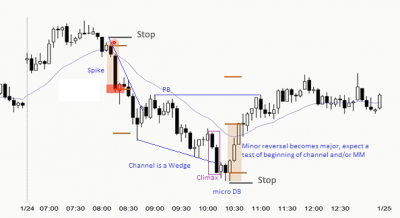
Both charts are bear channels so you must think: bull flag and expect an upside BO at some point. This happens either with a reversal pattern (slide 3) or a bull surprise BO (slide 4). This time, the wedge worked and got a major reversal while the surprise bull BO failed and the channel down resumed. See the emini analysis:
Regarding the channels, I would not base your decisions on them… they are deceptive because you can draw many using different points, using best-fits, dragging to many points… the ones you drew may seem logical to you but there are many others you could have chosen. You know what? The computers will not use the one you like!
Hope it helps!
I think it could be of value to try to "translate" the chart in front of me too another time frame. Without having to watch that other time frame. To help me see the bigger picture. I try to practice that way of thinking, because it's my (humble) opinion that everything we see in the chart, is always relative to something else. PB's can only be assessed "short", "deep",... in relation to it's context. That's the reason I counted. That way I could ascertain that in fact there was no difference between the two charts regarding number of bars. So one bear trend was clearly stronger than the other (Al often explains: Broad bear channnel = Tight bear channel in higher time frame = BO in even higher time frame) Rookies like me need things to hold on too. So I use it as a way of categorising the things I see. And I used it to falsify my initial judgment.
I'm also aware that there is never one true trend line. But Al spends conciderable time discussing them. So, as misleading as they may sometimes be, I will probably also need to study how they can be of value. I don't prefer one trend line over another. I just drew one line as an example. One some computers probably drew also. It's just one of the many factors that influence price
Thanks for your answers.
Marvin


