The support forum is built with (1) General and FAQ forums for common trading queries received from aspiring and experienced traders, and (2) forums for course video topics. How to Trade Price Action and How to Trade Forex Price Action videos are consolidated into common forums.
Brooks Trading Course social media communities
Hello everyone!
I'm a newbie here and I'm going through the course for the first time and I just finished lecture 13C(Always In).
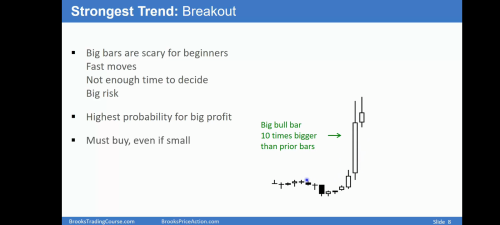
So far, what I understood is that if there is a sudden big breakout, we can expect a second leg in that direction and creates an opportunity for a high probability trade. However, the markets I trade in created this chart in the recent past and I'm not sure how might one trade it. The candle I'm referring to is the one having a star mark above it. To my understanding, the starred candle also turned the market Always in Short. Is it one of the exception situations?
Your insights would help me. Thanks!
P.S. - I am not good with forums so this question might have been posted in the wrong section with incorrect tags. Kindly pardon the inadequacy on my part.
Hi Abir,
The bar you highlighted was indeed a very strong bar, however the market was already Always in Short when it happened and therefore, that bar didn't change that status.
Every time I see such a strong bar, I pay attention to a few other points to help me understand if the bar is the start of a strong movement, or the end of it.
That bar was located at a third leg of a possible wedge, was very climactic (way bigger than all the other bars) and had a conspicuous tail at the bottom.
All these are red flags telling that this might not be a good trade to take. On top of that, when you see a bar like this one, you definitely want to see a good follow-through to confirm that the bears are strong. That did not happened here.
A last point I'd like to mention is that the sell of that bar was not triggered since the price never went below it's low.
I know it seems a lot to consider when entering a trade, but these things start to become easier as you study and apply them.
Hope that helps.
Best,
I see. Thank you. I was not aware that big bar's low needs to be broken for the signal to be generated. I must have confused it with the 'Sell the Close' Al says at many places. I understand the other points.
A couple follow up questions if you don't mind :
- Does one need to wait for a follow through lower close or sufficient break below the low of such bars is enough? I mean, in some frenzied cases the market starts spiking below the low of such candles rapidly and if I wait for the close, I might lose out on the move as well.
- As you can see, there is a gap 9 and 10 bars ago and that is due to the market closing the day before and the opening on the day the highlighted candle appeared. Should I consider last day's market movement as a continuation of the new day and draw the wedges and double bottoms and such keeping that in mind? Does that influence the Always In position as well? It seems to me like I need to consider it as continuation from the day before from your answer.
Thanks again. Sorry for the long questions.
I see. Thank you. I was not aware that big bar's low needs to be broken for the signal to be generated. I must have confused it with the 'Sell the Close' Al says at many places. I understand the other points.
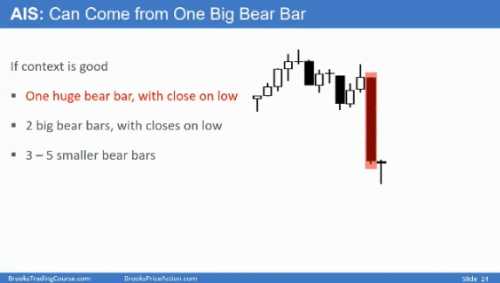
There are cases where a single strong bar alone can put the market in a "Sell the Close" trend, but that would usually be a bar at the beginning of a down trend and probably with a smaller tail on it's close.
Does one need to wait for a follow through lower close or sufficient break below the low of such bars is enough? I mean, in some frenzied cases the market starts spiking below the low of such candles rapidly and if I wait for the close, I might lose out on the move as well.
That's a trader's choice. You can wait until the bar closes, to make sure you meet the minimum requirement for a good FT (bar with a bear body would be that requirement). Or you can sell as soon as the price breaks below the surprise bar, or you can wait the price break and see if there are more buyers than sellers at that point as the bar is forming. Depends on how aggressive you are.
As you can see, there is a gap 9 and 10 bars ago and that is due to the market closing the day before and the opening on the day the highlighted candle appeared. Should I consider last day's market movement as a continuation of the new day and draw the wedges and double bottoms and such keeping that in mind? Does that influence the Always In position as well? It seems to me like I need to consider it as continuation from the day before from your answer.
That's right, you can consider the start of a new day as a continuation of the previous day. When you have a gap on the open, you can consider that gap as a 1 bar breakout and that can affect the Always In position. It really depends on the context. Personally I look for previous days in an attempt to spot important resistances and supports. I don't usually consider Always In from the previous day until I see some price action from the current day.
Thank you Bruno. Truly appreciate the help you provided. Really loving the Brooks trading community. Hope to see you around in the future as well. All the best!
Hi Abir, glad to help.
This community is very helpful indeed. There will always be someone here to offer guidance.
Hope you have an excellent progress on your studies.
Best,
Does erratic/extreme price action like this happen in the e-mini or is it mainly with lower volume stocks
This is by no means a low volume stock. It is the Indian Bank Index futures and is heavily traded. However, this was a monetary policy day for the market so you see this kind of extreme movement, not unlike how the Emini reacts to FOMC announcements.
Hi Abir,
Just want to add my 2 cents in addition to what everyone already said.
As Mr. Brooks stated in the course videos about "Math / Trader Equation", nothing is certain. everything wiggles around 40-60% chance.
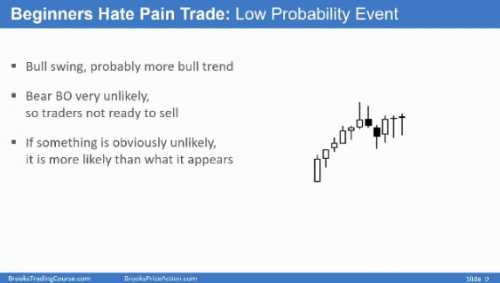
A major surprise bear bar would flip the market to always in short. However that's only ~60% certain (probably even less given we have no follow through bar yet at this point). The ~40% opposite which means the big bear bar is just a vacuum test can happen and it did in this case.
A vacuum test or second leg trap is even more likely in this case because it's a breakout of the prior low and breakout only has 50% chance of success.
The second part of the course is called "How to trade". Al will show there how to trade all the patterns explained in the first section of the course, "PA fundamentals". Keep going!
This thread is golden. I would like to keep coming back to this thread in future repeatedly for revision and hence this comment.


