The support forum is built with (1) General and FAQ forums for common trading queries received from aspiring and experienced traders, and (2) forums for course video topics. How to Trade Price Action and How to Trade Forex Price Action videos are consolidated into common forums.
Brooks Trading Course social media communities
Hello PA Traders.
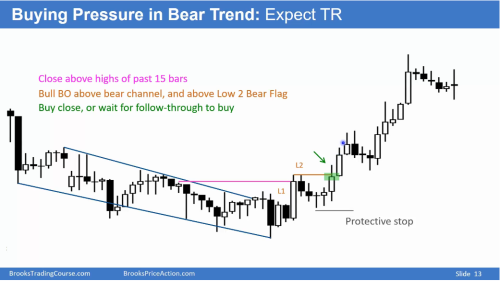
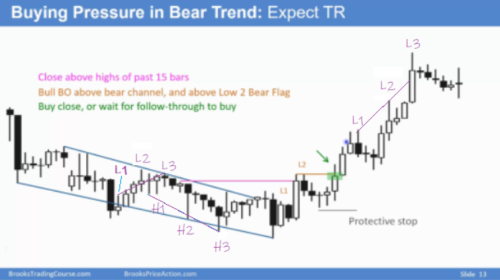
I do understand the general concept behind H1, H2 and L1, L2 etc. but I must say that I now get a little bit confused as to how Al labeled the L1 and L2 in this video 10B at slide 13? I have also attached the photo.
My guess is that Al is now labeling them as following:
L1 - It was a bear bar after a bull bar.
L2 - It was another bear bar after a bull bar
Can someone please explain since I believe he tends to mix up his bar counting to make it more confusing but also interesting. 🙂
I have also attached the photo.
This was great!
Can someone please explain since I believe he tends to mix up his bar counting to make it more confusing but also interesting.
For a bar to become a L1 the next bar has to go below and trigger the L1 but sometimes you have what Al calls an implied PB, because even tho the next bar didn't go below, it was a first leg up, and the L2 was the second. It is implied because if you go to a lower time frame you will clearly see the two legs up. This happens many times every day. See below examples in micro DB/DT from Friday's EMINI.
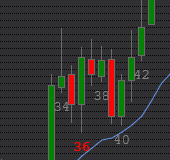
Bar 39 is the second leg down and 37 was the first, even tho 39 didn't go above 38, so 38 is an implied H1 and 40 is the H2 (also DB 36).
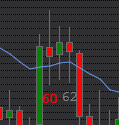
60 was the first leg up, and 62 was the second even tho 61 didn't go below 60, so 60 was the implied L1 and 62 the L2 (also DT 53).
Thank you so much for a clear understanding and explanation, ludopuig.
I believe I now get it.
So if we look at my attached photo, the L1 would be the implied L1 and the L2 would be an actual triggered L2 on that specific TF? But the reasoning behind an implied L1 is that if a trader goes to a LTF he would clearly see the two legs up(?)
So if we look at my attached photo, the L1 would be the implied L1 and the L2 would be an actual triggered L2 on that specific TF?
Correct and, sorry, I gave the explanation in the example charts I attached but forgot to link to yours.
But the reasoning behind an implied L1 is that if a trader goes to a LTF he would clearly see the two legs up(?)
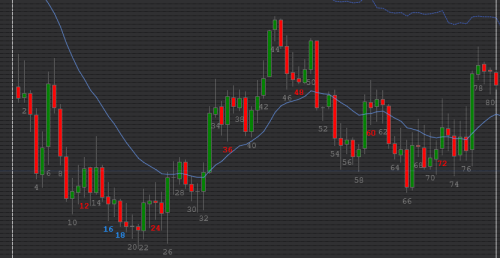
This is one way to see it, yes, but you don't have to go to a lower time frame to check, you can see it in your chart once you are trained to do it. The important factor to note was that at the L2 bar there had been two small legs up. It happens all the time in all kind of charts, in your same chart you have other implied PBs, see below:
