The support forum is built with (1) General and FAQ forums for common trading queries received from aspiring and experienced traders, and (2) forums for course video topics. How to Trade Price Action and How to Trade Forex Price Action videos are consolidated into common forums.
Brooks Trading Course social media communities
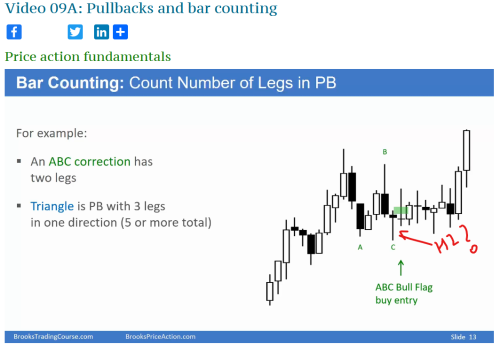
The bar next to A is a H1. H1 tried to resume the bull trend but failed. Naturally, C becomes H2. This is the second attempt to resume the trend.
Per def the H2 should have gone higher than the previous bar but that's not the case with C. Abir you mentioned it tried to resume the trend, is it because at a lower time frame there is an implied H2 with PB?
Okay, now I understand your confusion. No, it's not an implied PB on a LTF chart(it probably is, but that is not what is being discussed here).
So, to your understanding, the bar after C should be marked H2 right? As per the definition, you are correct. However, think of it like this. H2 is the second attempt to resume the trend. You are supposed to enter longs on H2s. So, although the bar next to C is an H2, bar C is the signal bar for the H2 setup.
You don't enter a trade after an H2 setup, for all we know, that bar could have been huge and you could have missed the entry. It's always better to be prepared, since technically the bar after bar C is a H2, so the moment it becomes H2 is when it crosses the high of bar C. So, crossing bar C high is the trigger for it to become H2. That trigger is the cue for you to enter your trade.
So, you are more concerned about the signal bar rather than the bar on which the signal is triggered. Does that clarify your doubt?
Absolutely it clarifies my doubt and nails the Hx Lx concepts. Thank you Abir!
Great explanation bro thank you for taking the time.
What i am confused about this H1 or H2 - we are able to get this after fact based on the complete price action right, we wouldn't call the H1 or H2 while the next bar is not formed correct?
That is correct, we wouldn't call the C bar an H2 signal bar until the bar after it breaks above its high, thus triggering the H2 and making the bar after C an entry bar.
If traders think an H2 entry is setting up, they might put a stop order above the C bar. And, as the next bar forms, it would trigger the H2 and we would then label it an H2 entry bar.
thankyou for the response and clarification
However, think of it like this. H2 is the second attempt to resume the trend. You are supposed to enter longs on H2s. So, although the bar next to C is an H2, bar C is the signal bar for the H2 setup.
How about this chart provided below?
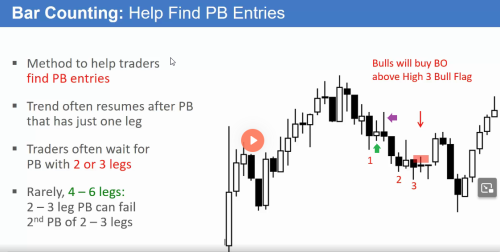
Why did AL marked that bear bar as a H1 bar and not the small bull bar (marked green arrow)?
Because the very first bar that went above the high of the prior bar was the bar marked purple arrow?
So, shouldn't the bull doji bar (marked green) should be H1 signal bar and the bar after that a H1 entry bar?
Bear bars marked 2 and 3 are h2 and h3 became signal bars since it triggered correct?
Could you please provide the video number you're referring to?
Hi Abir the video is 09A. PullBack and Bar Counting. TimeStamp: 21:03.
Direct link to the video: https://www.brookstradingcourse.com/price-action-fundamentals/video-09a-pullbacks-bar-counting/
Thank you!
Why did AL marked that bear bar as a H1 bar and not the small bull bar (marked green arrow)?
Please watch the video again, and listen carefully. Al not once mentions the 1, 2, 3 marked in the chart as H1, H2, H3. He is counting legs in the PB, or pushes down. He even puts his cursor on the inside bar(one you have marked in green) and mentions that the following bar(marked in purple) went above it so the inside bar is the H1 signal bar.
Bear bars marked 2 and 3 are h2 and h3 became signal bars since it triggered correct?
Bars marked 2 and 3 also became H2 and H3 signal bars since they triggered, correct.
Thank you Abir! I think I got confused because I was looking 1,2,3 as a Hx bars. But in this case these are the number of push down attempts and 2,3 were also push down attempts but became signal bars once triggered.
Thank you for your reply!! Will be more questions. 😉
Hi Abir!
Another Question to Check my Understanding
Video: https://www.brookstradingcourse.com/price-action-fundamentals/video-09b-pullbacks-bar-counting/
Look at the screen shot below:
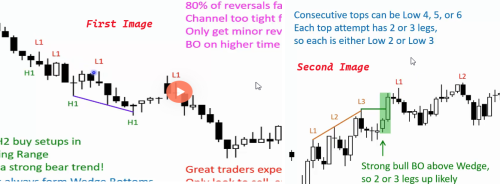
My understanding of First Image regarding Low 1, Low 2, Low 3
L1 bar- In a bear trend here, L1 bar becomes L1 bar if it has a higher low compared to its prior bar and the next bar breaks out below that bar. (In another words in a reversal attempt from a bear trend, if the first bar (reversal attempt bar) has a higher low and the next bar goes below the first bar then the first bar is marked L1 bar)
Do I have a correct understanding of First Image?
My understanding of Second Image regarding Low 1, Low 2, Low 3
In a bull trend here L1 is marked L1 bar because it does have a higher low compared to its prior bar (implying same concept for Image 1) , and even though the very next bar did not go below this L1 bar (unlike the Image1) the bar after this did breakout below this L1 bar. But based on the Image 1 concept why didn't we mark the bear bar after L1 bar a L1 bar instead that bull bar.
If i see bars marked L2, and L3 in this image it validates my understanding but just a little confused about marking of that bull bar as a L1.
Thanks in Advance!
Sudeep


