Market Overview: Nifty 50 Futures Nifty 50 Wedge Top Overshoot on the monthly chart. After the bull breakout of the wedge top, the market gave a weak bull close on the monthly chart. Bulls need good follow-through bars to successfully break out of the wedge top. Bulls need to provide a strong bull close above @20000 level in […]
Nifty 50 Big Round Number on Weekly Chart
Market Overview: Nifty 50 Futures Nifty 50 Big Round Number on weekly chart. This week, the market had come close to the @20000 level but ran into strong resistance, creating a long tail at the top of this week’s bull bar. The market is trading inside of a tight bull channel on the weekly chart, […]
Nifty 50 Wedge Top Breakout
Market Overview: Nifty 50 Futures Nifty 50 Wedge Top Breakout on the monthly chart. On the monthly chart, the market formed its third consecutive bull bar as it closed close to its high. This month, the market also provided a strong close above the wedge top (breakout). In general, there is a 25% chance of […]
Nifty 50 Potential Trading Range
Market Overview: Nifty 50 Futures Nifty 50 Potential Trading Range on the weekly chart. This week, the market established a small bear bar. Since the bar is closing near to its low and has a long tail above it, some bears will look to sell at the low of the bar in anticipation of a probable […]
Nifty 50 Outside Bar on Weekly
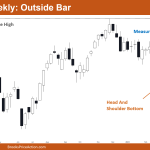
Market Overview: Nifty 50 Futures Nifty 50 outside bar on weekly chart where the market created a bear doji bear this past week. It is currently trading inside a tight bull channel. Measured move of the head and shoulder bottom and the all-time high could be acting like a magnet for the price. The daily […]
Nifty 50 Trading Range Most Likely
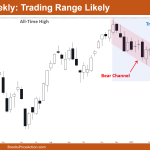
Market Overview: Nifty 50 Futures Nifty 50 trading range most likely. This week’s market produced a bullish close; but, the bull bar’s small body and short top tail indicate that a small pullback is likely. On the weekly chart, the Nifty 50 is still trading inside the tight bull channel. The market recently has not created […]
Nifty 50 Wedge Top
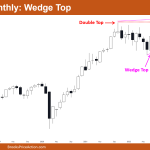
Market Overview: Nifty 50 Futures Nifty 50 wedge top on monthly chart. On the monthly chart, the market produced a powerful bull bar that closed very near to its high. The Nifty 50 was also able to close above the big round number 18000, which may be a sign of strength. Similar to the monthly chart, the market […]
DAX 40 Bull Micro Channel Possible Wedge Top
Market Overview: DAX 40 Futures DAX futures was a bull micro channel and a possible wedge top. It is a low probability sell signal, taking a chance that it is a wedge and failed breakout above a double top. But most traders expect higher prices, so bulls will scale in lower, knowing it is unlikely […]
Nifty 50 Potential Trading Range
Market Overview: Nifty 50 Futures Nifty 50 potential trading range on the monthly chart, the market formed a small bull bar after two consecutive bear bars. Here, bulls would be trying to breach the all-time high and bears would be willing to sell for Low 2 after the fake bull breakout. On the weekly chart, […]
EURUSD Small Bull Doji, Wedge Top
Market Overview: EURUSD Forex The EURUSD Forex was a small bull doji on the weekly chart. Bulls want an endless small pullback higher. If there is a pullback, they want the pullback to be sideways and shallow. The bears want a reversal lower from a wedge top. EURUSD Forex market The Weekly EURUSD chart The Daily EURUSD […]
