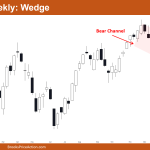
Market Overview: Nifty 50 Futures Nifty 50 wedge on the weekly chart, due to the long wick at the bottom of the candle, bears may not be interested to sell next week. The daily chart of the Nifty 50 showed a bear breakout of the wedge, but it appears that few bears anticipated the move, which […]
Nifty 50 Futures Wedge Bottom
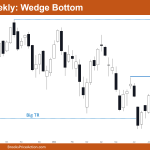
Market Overview: Nifty 50 Futures The Nifty 50 on the weekly chart is forming a Nifty 50 futures wedge bottom and trading range price action, with increasing bad follow-through bars and increasing tails above and below bars. The market is also forming reversal patterns which is a sign that market is in a trading range phase. […]
DAX 40 Wedge Bottom and Tight Trading Range
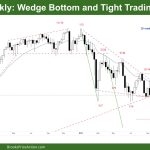
Market Overview: DAX 40 Futures DAX futures was a DAX 40 wedge bottom and a tight trading range, low in a large trading range. it could be a double bottom buy setup, but bearish enough for a second leg down next week. Bulls are looking to swing for a break higher and measured move up. […]
EURUSD sideways at wedge bottom pullback
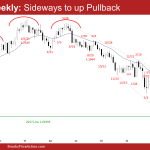
The EURUSD Forex broke below the 2017 low with follow-through selling recently. The bulls want a reversal higher from a wedge bottom (Mar 4, May 13 and July 14) and a trend channel line overshoot. However, the move down is in a tight bear channel. That means strong bears. Odds slightly favor lower prices for the EURUSD after a larger pullback.
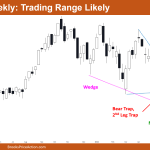
Nifty 50 futures trading range likely
Market Overview: Nifty 50 Futures Nifty 50 futures on weekly chart gave strong bull close after wedge bottom and 2nd leg trap increasing chances of upside momentum for next week. But trading range likely due to sharp selloff in previous week. Nifty 50 on daily chart turned out that bear flag was final flag, so there […]
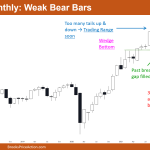
Nifty 50 futures weak bear bars
Market Overview: Nifty 50 Futures The Nifty 50 futures formed 3 consecutive bear bars after long time in monthly chart, but are weak bear bars which are not enough to convince more bears to short the market. Nifty 50 on weekly chart gave bad follow through to a High 1 bull bar closing near high (green box). […]
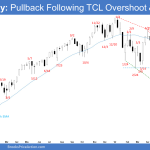
Emini reversed higher from trend channel line overshoot
The S&P 500 Emini futures reversed higher from a trend channel line overshoot and a wedge bottom. The bears failed to create follow-through selling below May low on the weekly chart. The bulls want a reversal higher from a trend channel line overshoot and a wedge bottom. The bulls will need to create follow-through buying next week to convince traders that a reversal higher may be underway.
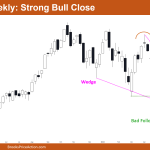
Nifty 50 strong bull close
Market Overview: Nifty 50 Futures Nifty 50 strong bull close on futures weekly chart, near wedge bottom line, and possible failed bear breakout of a cup & handle pattern. On the daily chart, Nifty 50 forming possible final flag, so the least bulls can expect is a trading range on both weekly and daily charts. Nifty […]
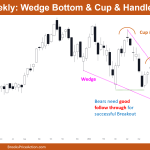
Nifty 50 wedge bottom and cup & handle
Market Overview: Nifty 50 Futures Nifty 50 wedge bottom with strong bear close this week. Overall structure is climatic and probably a halt expected next week due to wedge bottom. Wedge bottom usually has a double bottom breakout, so bears if want to continue the trend down they would need another bear close next week as […]
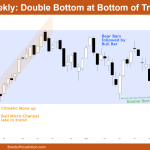
Nifty 50 futures double bottom at bottom of trading range
Market Overview: Nifty 50 Futures The Nifty 50 futures on the weekly chart formed a double bottom at bottom of trading range which is also the bottom of a bull micro channel. Nifty 50 on daily chart still in the broad bear channel and forming wedge bottom near March month low which is strong support. Nifty 50 […]
