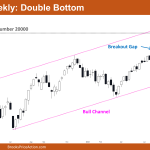
Market Overview: Nifty 50 Futures Nifty 50 Double Bottom on the weekly chart. On the weekly chart, the market is currently trading inside a large bull channel. This week, the market formed a strong bull close that resulted in a breakout of the important round number 20000. Bulls were able to obtain a breakout gap, […]
Nifty 50 Bull Flag
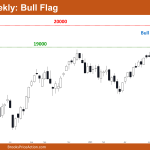
Market Overview: Nifty 50 Futures Nifty 50 Bull Flag on the weekly chart. On the weekly chart, the market formed a strong bull bar following an unsuccessful attempt at a reversal. Bulls gave a bull breakout of the bull flag, and based on the height of the bull flag, this could cause a measured move […]
Nifty 50 Cup & Handle
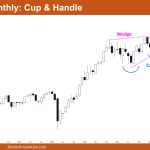
Market Overview: Nifty 50 Futures Nifty 50 Cup & Handle on the monthly chart. On the monthly chart, the market showed a bull breakout of the cup and handle pattern in the month of July, but since the market did not produce a strong follow-through bar this month, the likelihood of a failed bull breakout […]
Nifty 50 Wedge
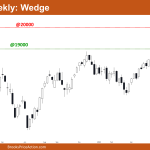
Market Overview: Nifty 50 Futures Nifty 50 Wedge on the weekly chart. The market formed the fifth consecutive bear bar on the weekly chart, which is closing close to its low. However, the bear bar has a long tail at the top, suggesting a potential trading range rather than a reversal. The likelihood of a trading range […]
EURUSD Inside Doji Bar, Tight Bull Channel
Market Overview: EURUSD Forex EURUSD inside doji bar and tight bull channel formed on weekly chart which means strong bulls. The bulls want a strong breakout above the February 2 high and another strong leg up. If there is a pullback, odds slightly favor buyers below the first pullback from such a strong bull micro channel. […]
EURUSD Pullback Stalled at 20-Week EMA
Market Overview: EURUSD Forex The EURUSD Forex market pullback stalled at the 20-week exponential moving average (EMA) for the last 3 weeks. The bulls want a larger second leg sideways to up to retest February high from a higher low major trend reversal and a double bottom bull flag with January 6 low. The bears […]
Nifty 50 Cup & Handle
Market Overview: Nifty 50 Futures Nifty 50 cup & handle on the weekly chart, bulls failed to follow through after attempting a double bottom. Now that bears have closed a strong bear bar, some bears may decide to short the cup & handle pattern on the weekly chart. On the daily chart, price action is […]
Nifty 50 Futures Wedge Top
Market Overview: Nifty 50 Futures Nifty 50 futures wedge top formed on the weekly chart, and gave a bear close this week after giving a bull breakout above the all-time high level the previous week. This bear bar on the weekly chart is also an inside bar which can result in bulls losing interest to […]
Emini Wedge Bear Flag, No Follow-through Buying
Market Overview: S&P 500 Emini Futures The S&P 500 Emini futures formed an Emini wedge bear flag on the weekly chart. The bulls did not get follow-through buying. The bulls expect at least a small second leg sideways to up after a pullback. The bears need to create strong consecutive bear bars closing near their lows, similar […]
Emini Third Leg Down – Sept Close at Low
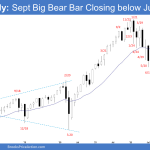
Market Overview: S&P 500 Emini Futures The S&P 500 Emini futures September candlestick closed below June low. The odds of an Emini third leg down of a larger wedge pattern have increased. Bulls want a reversal higher but need at least a strong reversal bar or a micro double bottom before they would be willing to buy […]
