The support forum is built with (1) General and FAQ forums for common trading queries received from aspiring and experienced traders, and (2) forums for course video topics. How to Trade Price Action and How to Trade Forex Price Action videos are consolidated into common forums.
Brooks Trading Course social media communities
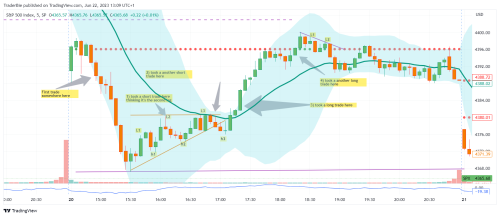
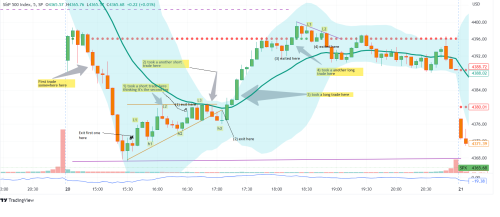
This is S&P 500, 20/06/2023. The market started with making low of the day. Although I took few good trades but hardly made any profit since I was trying to swing trade.
After making low of the day it created a Bull flag so I was expecting it to go further down a measure move down but instead it broke out to the top creating a range. I find it difficult to understand when the market is going in a range and how I could trade it better because lot of times when it's in a trading range, it moves up and down quite a lot at the extremes of the range so, it quite hard to make it out whether it's going create a range or move in the always in direction?
I also tried to enter slightly below the extreme of the top of the range but then the market sometimes goes back to the top of the range and then comes down or break out.
Any advice would be great.
Regards,
Nandkishore
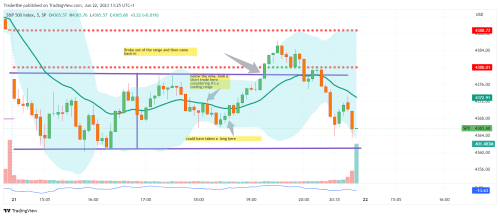
Here's yesterday's S&P. I took a short trade considering it's in trading range but then i closed at it's high when market reversed up. Ideally if this was not in range I would have taken a long trade after the signal bar. And when the market reversed up to the top I couldn't take a short entry since I wasn't sure if this was just a 2 legged correction or it was going down, turned out it went down instead to the bottom of the range. Any suggestions how to trade this?
Where were your exits?
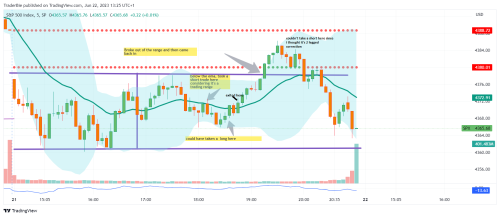
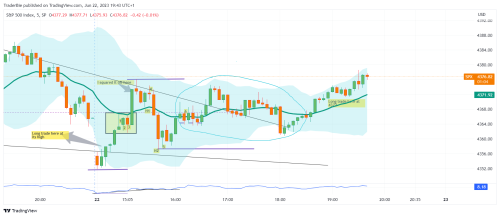
This is today's image 22/06/2023
the first long trade was profitable, i squared it off at the top of climactic bullish bar but the bars 1,2,3 even though they have big wicks I didn't exit although I wasn't sure whether it was going to go up because 2 was bearish bar when it was forming.
I took an entry at H1 but exited at the next big bearish bar with a loss. I took a long entry at bar 5 at it's high but exited in next bar's close. I tried taking a long entry at 6 but exited two bars after that since it was a bearish bar open at the close of the bearish bar.
I took a couple of short trades in the circled area but ended up in losses
I am long now at 4372
It seems like you are doing fine during trends but struggling during TRs. Are you clear about the market structure? In TRs, you should BLSHS. You are entering shorts near lows and longs near highs.
Also, do you go through the daily setups chart that Al posts? I think basing your questions on that would help you streamline your learning process.
Abir, i think you are bang on, if it's good trend i catch but I struggle in TRs. I know in TR to BLSH but my problem is identifying trading ranges like what I talked about at the beginning this post.
I was looking at Al posts couple of weeks ago but it takes a day or two before you see the latest one I think unless I was looking at the wrong place.
Any links to the specific video which could help me with this, firstly to identify that the market is in TR. Secondly I know to buy low and sell high, but the range is not always at it's extremes sometimes price doesn't touch the extremes of the range so I end up buying somewhere above and then if the market goes down i end up exiting thinking might be breakdown.
Similarly problem at the top of range while selling.
Also there is not much price movement in S&P and I trade only couple of contracts makes it difficult to make profit while trying to limit my losses
First chart:
Your first short trade is pretty much perfection. As is your first long trade.
The pullback actually was quite tricky, because it started as a bear flag, then became an endless pullback. The good news is, this won't happen everyday.
Trade 4 was avoidable. The market had just had two big trends, one 30-point bear trend, then a 30 point bull trend. Once it's broken the day's high, it was unlikely that it'd go much further up, because a lot of energy had already been spent. It was equally unlikey at this point for it to convert to a bear trend all over again - so the result is a trading range.
I assume you still had a profitable day, in spite of the three losses?
Also how would you know if it's has broken the trading range? I mean how bars before you can say it broke the TR and once can enter in the direction of the trend ? In one of my images it went up 4 bars above the TR and while it was in the TR it was trending up with big bull bars, more as a spike.
Thanks PB for the analysis. The bit you mentioned 'The market had just had two big trends, one 30-point bear trend, then a 30 point bull trend. Once it's broken the day's high, it was unlikely that it'd go much further up, because a lot of energy had already been spent. It was equally unlikely at this point for it to convert to a bear trend all over again'
This above is useful information to understand when it can go into TR, thanks for the tip. Yes a little bit of profit not much.
Any comments on the second image
where I took a short trade below the ema thinking this is a trading range and the price will go down to the bottom of the range but after couple of bars it began a bull trend
and 22/06/2023 image?
I'll try to analyse the other charts later when I have a bit more time, but I just wanted to point out something about the first chart.
I have attached below slide no. 489 from part 11 of the encyclopaedia, from the topic "endless pullback up". As you can see your first chart is almost identical to Al's example.
I suggest you consider buying the encyclopaedia. In slide 485 of the same section, Al provides some guidance on how to decide if a pullback is going to become an endless pullback.
I was looking at Al posts couple of weeks ago but it takes a day or two before you see the latest one I think unless I was looking at the wrong place.
You probably were, since I find the charts to have been before the next market day. Most of the time, it is at least 6-7 hours before the market open. I cannot stress enough on the importance of comparing your readings with his.
Any links to the specific video which could help me with this, firstly to identify that the market is in TR.
It's not really a single piece or just a fair bit of information you are missing which can be remedied by watching a couple of videos. You still need to go through the phases where you build up an understanding which you will eventually have to break down and recreate. This process goes on for some years until you are a strong trader. Dedicating more time to this process speeds it up but I don't think it is some mechanical 'watch a video and get good' kind of thing.
Still, given you are stuck on this problem, I'd recommend watching all videos covering TRs, market structure/regime, teaching how to trade a broad channel, climaxes and 2nd leg traps. Once done, go through the swing trading examples section. Like PB mentioned, encyclopedia is a must if you want to effectively learn and apply BTC PA principles in your trading.
Also how would you know if it's has broken the trading range?
This is covered in the course and in the encyclopedia as to the hints the market gives before it breaks out of a TR(not always).
Even while in TR, there are rules and buy/sell zones where it is okay to buy. For a swing trader, trading a TR with stop entry is probably the toughest thing to do. It becomes even more difficult if you are making mistakes and don't know what to expect from the market.
This is exactly why I recommended using Al's markups as guideline. Otherwise, this topic would become extremely broad and impossible to cover using the forum. That is why you have the course. You learn from there, you apply it and ask here when you get stuck.
Thanks PB, this was really useful. I think I have wait for 2 months before I can buy the encyclopedia. I asked this question in the forum before. I purchased AL's training course a month and half ago I think.
Thanks Abir. I almost finishing his Price Action Trends book. I'll have to re-read the TR chapter because I didn't get the full understanding of it. Also I have purchased the online trading course which I have been watching, not yet reached the TR part. Thanks for all this information, even you guys giving bit and pieces at the minute really helps a lot.
I don't think I helped out much here. I would love to discuss charts when the scope isn't so broad like here.
I'll have to re-read the TR chapter because I didn't get the full understanding of it.
I would suggest though, to not keep the studying part just to the books or videos. After you learn something, try and find out the same on the charts that you trade, apply the concept that you learnt. This will help you understand the concept in more comprehensive depth. If something doesn't add up, ask here. This will help you in the long run.
All the best!
![[PB Endless U].5 [PB Endless U].5](https://www.brookstradingcourse.com/wp-content/uploads/wpforo/attachments/12536/thumbnail/1802-PB-Endless-U-5.png)
