The support forum is built with (1) General and FAQ forums for common trading queries received from aspiring and experienced traders, and (2) forums for course video topics. How to Trade Price Action and How to Trade Forex Price Action videos are consolidated into common forums.
Brooks Trading Course social media communities
I am having a hard time lately deciding if the day is going to end up in a trend or a trading range on the 5 minute chart for E MINI S+P. I am perceiving break outs during range days and getting stopped, and today 5/12/23 I thought it was going to be another range day so I scaled lower and eventually got stopped during morning session.
Can anyone share some general advice or a list of clues to help determine a higher probability of a trend vs. range bound day? Thanks everyone and good luck trading!
Hi David,
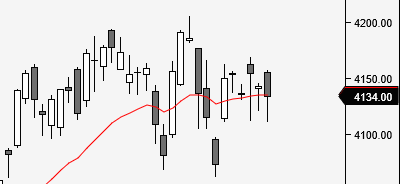
It may help to reference HTF charts to get an idea of what to expect on 5M. For example, look at the kind of days we've been having in ES on daily chart since April, especially the last 5 or so. Most end up as dojis, so can expect a reversal back to OOD towards end of day and focus mostly on scalps throughout the session.
Also browse the video course pertaining to this, for example,
Video 47A has a section "Look for signs of Trading Range".
Bonus video 5: "Trading Tight Trading Ranges on the Open"
Vice versa for trends: when daily has consecutive trending bull bars, there is a higher probability that the open will form the lower tail of the day by pushing down that fails and reverses up into a trend day.
Hope that helped!
CH
____________________________________
BPA Telegram Group
Very helpful I will have to reference those videos and also keep in mind current position on the HTF bigger picture. Thanks for the help!

