The support forum is built with (1) General and FAQ forums for common trading queries received from aspiring and experienced traders, and (2) forums for course video topics. How to Trade Price Action and How to Trade Forex Price Action videos are consolidated into common forums.
Brooks Trading Course social media communities
26/27 = H1
27/28 = H2
?
The correct reading would be based on context and not assumptions. Anything else and you will simply be hindering your own progress. Patterns without context do not work - - - All of Al's patterns are firstly based on an underlying context and without that, the concepts fail. The next part comes into real live market reads on the fly. . . . A different discussion.
So, what is here?
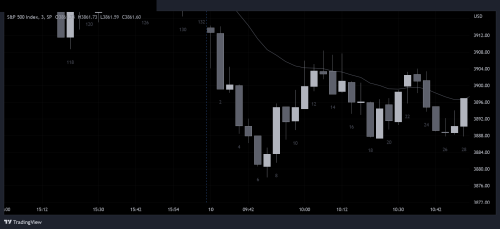
Well, it is chopped off, but a significant decrease in prices from yesterday through bar 7. You need to see this first! What does this do? Well, what is the context? - - - right: trend mode and retracement measuring. Watch that ema. As you are beyond 10 am early decisions w/o the ema are not a worry.
So what happens at the ema? 13, 14, 15 -> Rejection! What do you expect next? Right, potential retest of the lows, 7. But it stalls out doesn't it? Some buying pressure with a minor 20 gap bar. So what is next? Again, potential retest and need to watch 18,19,20 to see if the support holds or not. Is buying pressure real? That is what 26-28 is about.
26 - nothing doing
27 - bear bar as it finishes in bottom 1/3rd
28 - is rejection, but they have you buying at 50% of the potential trading range pattern.
So, buying comes to how well prices move through that bar or not. If you do not see good consistency on the bar, don't touch but it is a potential opportunity based on context and 28 showing good rejection (or buying pressure).
Hopefully helpful and good trades to you!
The correct reading would be based on context and not assumptions. Anything else and you will simply be hindering your own progress. Patterns without context do not work - - - All of Al's patterns are firstly based on an underlying context and without that, the concepts fail.
I read this as a HL DB MTR or HL Triple Bottom MTR ( 9 - 19 - 26 )
Other traders have said Triangle, but I read it as MTR. Simply: Bear trend, climactic (exhaustion?) 1-6, Bull micro-channel 7-13 highs above EMA (if the EMA is accurate on the daily chart open), wedge down 14-16-18, HL MTR 19-23 with 3 closes above EMA (if that is accurate), then DB HL MTR with 26-28 which I cannot figure out the correct reading.
9 Low and 19 Low were both 3887.25
26 Low and 28 Low were both 3887.5
26/27 is an H1, first high above a prior bar after pullback.
28 is Outside, so I don't know if that's a continuation of H1 or H2.
result...
Thank you for posting that graphic. It makes a difference on a variety of levels. Context is the greatest variable in the hierarchy. However, the "invisible variable", probability ties into the picture and at various points changes the landscape. This can take some time though. . .
At first, everyone gravitates towards "patterns" though. It is a static variation of what traders need to internalize with real screen experience.
Elements:
Massive downtrend. Massive, massive, massive. At some point there will be some reprieve but never hop on early. Some aspects of interest. Corrections into the pattern before a MTR often require 1/2 the bar count. This is an aspect of symmetry, and timing (TBTL on the highest timeframe the pattern is present). It obviously isn't cornerstoned on the 5 minute chart, but a higher level one, but we do not need to reference it. The relative bar count is essential here.
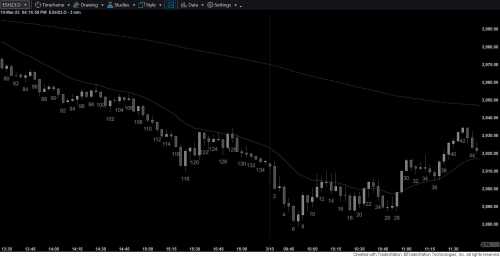
So at 28, an MTR is early. 13, and 23 are critical variable highs. It is 29 & 30 that change the game 3 very good bull bars of good size all finishing at or near their highs, and also breaking out of the 13,23 trading range with reasonable follow through. 30!!!! That is follow through and 31-36. . . What the heck is that?!!!!
Exactly, you have to note the micro gap. "Mean it?", "Mean it?", "Mean it?". It is the breakout test that is weak and shallow. That is a direct testing and the switch into Always In Long. 37 -> YES WE MEAN IT!!!!
Game has changed, and shorts quick cover 38-42. Why - because everyone is in agreement and 23 limit order shorts are trapped! 23-27 shorts too. 27? Why short at the potential bottom? 26 & 27 also represent 2 attempts to move lower and 28 traps them in and says -> Ha-Ha-Ha!!! 29 and 30 potential "seal the deal" and as Al says, the true value is in the test of the breakout 31-36!
See how through all of this the probabilities are changing? That is precisely what is occurring.
Confirm by digging out many charts and noting the transitions.
Hopefully helpful and good trades to you!
26/27 = H1
27/28 = H2
?
It's an H3. Bulls tried to reverse the market 2 times before and the 3rd time they succeed.
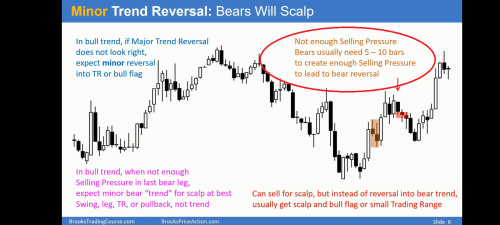
Yes it could be a minor reversal which turns out to be a major reversal but after the sell off we had the day before, do you think this amount of bars would be enough to reverse the market?
I dont think its enough and at this point i would only look to sell higher. If you do think the market is going to reverse, i think bar 60 (3m TF) would be a better (possible) HL MTR which is also a W + nested W + FBO and with a very good SB.
Nice research. Note, you will want to understand the process, and not simply the picture. There is a lot of analysis which is not marked or discussed on a single chart, and deals with state changes and tests of breakouts.
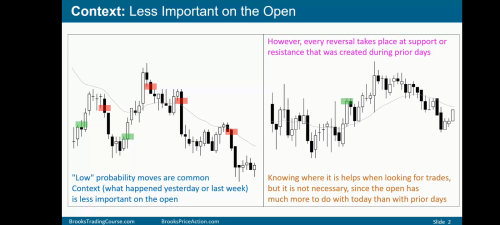
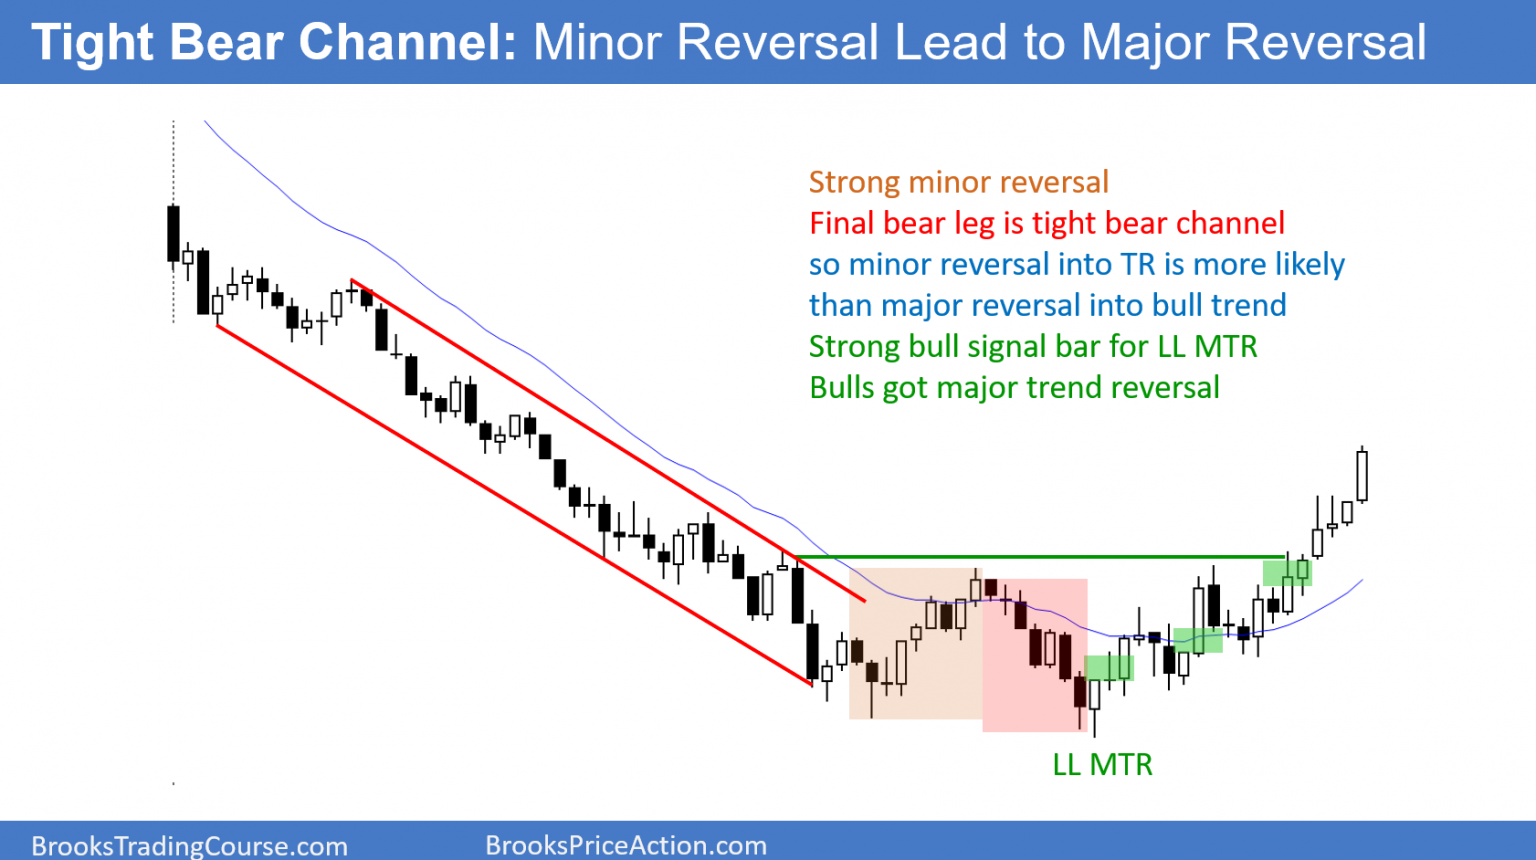
From the encyclopedia graphic, your example relates to green buys 2 & 3, but not 1. The original example has truncated 1.
If you take the time to understand this, and review the detailed listings from my earlier messages, then a "light bulb" of how Al, or other profitable traders are analyzing this situation (from a stop buy order perspective), and should make a lot more sense.
The "patterns" are a visual representation of how order flow and tests are actively happening in the market. Note this, order flow and tests. On 5 minute charts, these are accumulated into 81 static segments of a fluid process.
Hopefully helpful and good trades to you!
Yes it could be a minor reversal which turns out to be a major reversal but after the sell off we had the day before, do you think this amount of bars would be enough to reverse the market?
I though Al said 10 bars for an MTR.
7-27 has 10 bull bars. I thought the strongest evidence was 7 bar bull micro channel 7-13, follow up bull MC 19-23. Triple bottom 9-18-26 and triple BO test with 7. And multiple pushes / closes above EMA, but not sure how accurate EMA is on day session chart.
60 looked great, but bad signal bar 59.
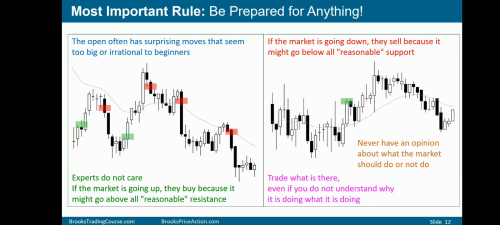
Regarding the previous day, Al says take it into account, but be ready for anything.
Chapter 48: the open
Chapter 22: MTR
Context is leading. After a beartrend like the day before, bulls need more te reverse the market.
Zoom your chart out and ask yourself the same question, is this attempt of the bulls enough?
By the close of bar 28, there is lots of good evidence for a move higher.
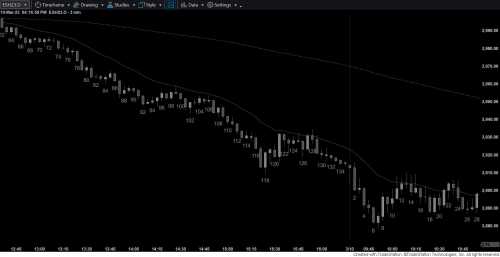
First reversal 118-128 minor, maybe next is major.
New day, anything can happen on the open.
1-6 parabolic wedge open, climactic, unsustainable.
7 bar bull micro channel up, then after wedge down, 5 bar bull micro channel up. 3 closes above EMA. 28 bars sideways, prior trend has less influence.
3 pushes down / 3 breakout tests : 9-18-26 and all have the same Low. Nothing lower than bar 9 low.
Magnets above: yesterdays Low, yesterdays Close, Todays Open
The signal, I don't understand. Sell the close bears 25, disappointed 26 get out breakeven 28 ? Also, bad signal bar 26, then outside bar 28, so confusing.
By the close of bar 28, there is lots of good evidence for a move higher.
Yes, and we have gone higher. Bears didn't want to sell lower, so the market had to go up to find new sellers.
First reversal 118-128 minor, maybe next is major.
Maybe, doesnt have to mean the next one is major.
New day, anything can happen on the open.
Yes new day, anything can happen. Big up Big down Big confusion, TR probably. So is buying 28 in the middle of the range a good idea?
7 bar bull micro channel up, then after wedge down, 5 bar bull micro channel up. 3 closes above EMA. 28 bars sideways, prior trend has less influence.
What does this MC look like? Do they look very strong or do they have a lot of overlap making it less strong?
The signal, I don't understand. Sell the close bears 25, disappointed 26 get out breakeven 28 ? Also, bad signal bar 26, then outside bar 28, so confusing.
26 is still a bear bar, so STC bears stayed in their shorts. But when bar 27 closed they are disappointed, so they got out at bar 28 which becomes a OU bar.
26 is still a bear bar, so STC bears stayed in their shorts. But when bar 27 closed they are disappointed, so they got out at bar 28 which becomes a OU bar.
So if we, and everyone else, know bears just gave up on bar28, then that's a good buy.
