The support forum is built with (1) General and FAQ forums for common trading queries received from aspiring and experienced traders, and (2) forums for course video topics. How to Trade Price Action and How to Trade Forex Price Action videos are consolidated into common forums.
Brooks Trading Course social media communities
Hi,
I have been a long time student of Al's PA teachings especially the videos and the daily blog on Emini.
Earlier, I used to be more of a swing trader with multi-day timeframe for trades.
Now, I'm dabbling with very much applying Al's methodology on the 5-min chart to identify buy/sell setups using PA and then managing trades towards exits.
One of the challenges that I'm working on is to become more consistent with my profits.
Especially, today was not a very good day as I had tried to "scale-in" into trades multiple-times based on a "setup" (based on bar charts, price action) only to find the price reversing direction within next bar. Maybe today was one of those days, but how I'm looking for others' perspectives on how they over came such barriers before getting to more consistent profitability..
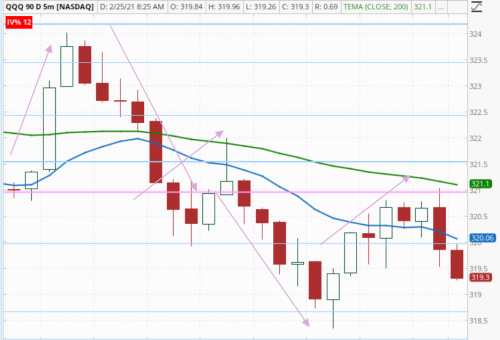
For example, the below chart (QQQs 5-min today) looks great in hindsight
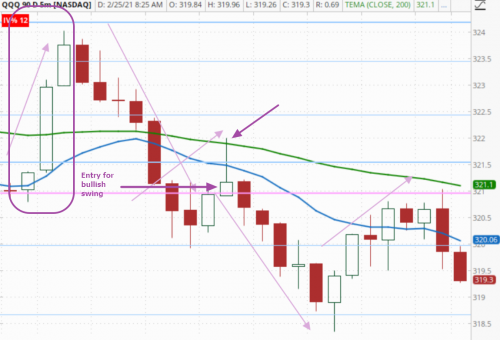
But had I placed a bullish trade after the big bull body candle that closed at $321 (middle of the chart), the next candle - price moved all the way to $322.5 only to reverse creating a long wick on top - sellers jumped in and the direction reversed.
What could have been a decent 2-3 point swing move end up into a loss as the "price moved too quickly" before I realized the direction reversed.
Thoughts, comments, advise welcome!!
Thanks,
Buying a 8 bear bar microchannel and below EMA is a LP trade and you should have waited for a second entry if you wanted to swing. The second leg down was also tight so the swing buy at the bottom of the chart would probably be a minor reversal as well. The MKT never went AIL so the bears were in control. Bears had another setup at the last two bars of the chart, the second last being an OO setup at EMA, and the last bar closing on the low.
Hi Djk.
I'm a newbie, but here's my interpretation:
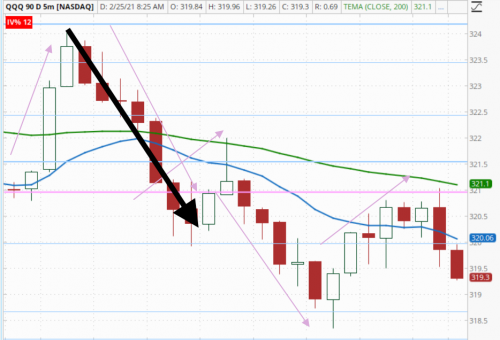
First, we're in what looks like a nice bear trend: seven consecutive down bars; not a single up bar; many close near their bottoms; the fifth bar from the top is a BIG down bar: opened, hardly went higher, then dropped and closed at its lowest point. (I added the big black arrow to your snapshot.)
Wouldn't Al say, in such circumstances, that "a breakout attempt by the bulls has 80% probability of failing"?
So... it looks to me like a failed breakout attempt in a bear trend that eventually went from 324 to 318.5...
Isn't it nice to be able to make such an analysis, IN HINDSIGHT!?!?
Thanks for both the comments!
Yes, the key point is the chart looks 'kind of obvious' that a bullish reversal is LP "in hindsight"
Yes, after the fact, the bear micro-channel and the failed reversal looks fine to me and this has been one of the areas I have been struggling to get better at.
For example, the way I rationalized the bullish swing trade "in real-time) was the bullish candle closed at its high (small to no wick as Al woud say), the big bear bar (2 bars prior to the failed bull reversal) could has been a sell climax bar. The horizontal red line was a 100% Fibonacci retracement of prior bear swing. And when the 2nd bull bar touched the EMA, "at that moment", it looked like 2 bull bars with full body and it felt like I was going to miss out on the bullish swing. I stepped in and BOOM, I started to see the wick on top of the bull bar developing 🙂
Perhaps it is more practice and really getting the probabilities into my head a bit more - that the bear micro channel (first leg) makes a bullish reversal a LP trade - no matter how the chart looks at that point in time ...
On some days, the always-in direction is a bit clearer and on other days, it never seems to be fully evident and the bulls and bears just seem to trade control every few bars! At least on this chart, on additional lesson for me is to focus more on how the price is responding to EMA while also looking at the price action - from a overall CONTEXT (to the left) as Al would say ..
Thanks again,
It is important to not mistake the powers that give you the hindsight with the fact that it can be done in real-time (otherwise this would all be non-sense). You are right that PA is difficult and your arguments to take the long sound good but are wrong and this is going to be like this for a long time while learning, but keep pushing because as any skill it can be learnt and the rewards are out there waiting for you!
I stepped in and BOOM, I started to see the wick on top of the bull bar developing 🙂
Ha ha ha! Yeah! I know what you mean. It happens to me all the time: I could swear the ES god was watching over my shoulder and as soon as he saw me go long, he made the market reverse!!! Happens to me all the time.
But it has helped me and here's how: I finally realized that when this was happening, it was because I took a trade too late. I hesitated for too long. The right moment had passed and I was now taking a trade at the worst possible moment.
As a result, I am trying to enter trades quicker, as soon as I see a good setup OR I acknowledge that the moment has passed and I sit on my hands, do nothing and wait for the next setup.
Another lesson I have learned (here's another contradiction in the world of trading) is to WAIT for confirmation! And wait for the close of the bar! There are hundreds of thousands of traders (and computers) watching the ES on a 5-minute chart and they're all waiting to see what this bar is going to look like, at the end of its five minutes of existence.
Well... I wish you good trading!
Thanks both of you!
I appreciate the kind words and I couldn't thank Al for this community and the blog as well - without which, getting out of a funk (when you have few days in a row with trades that turned into lemons) might be be hard.
I agree with Ludopuig that PA in hindsight can be quite a bit different then executing trades skillfully based on PA in real-time! But I see the value of hindsight and I plan to practice the setups, probabilities (& the psychology aspects) more to continue to get better,
Thanks
I agree with Ludopuig that PA in hindsight can be quite a bit different then executing trades skillfully based on PA in real-time!
Hi Djk!
Hey! There is a way to make "real-time" similar to watching old, static, frozen-in-time charts!
Here it is: on a 5-minute chart, at the start of each and every bar, close your eyes! And keep them closed for 4 minutes and 58 seconds! Then open them and look at the result! But briefly, because you must close your eyes again, quickly!
I swear that if you try this method and it happens that your 2-contract trade has managed to drop 9 or 10 points in those 4 minutes and 58 seconds, you will suddenly have a very different understanding of the expression "price ACTION"!
Djk, do you know what ballet is? You know, the dance? Does looking at this picture give you a good understanding of what ballet really is?
Ha ha ha! Just kidding! I know I'm being facetious!
But seriously: charts do help us analyze markets. And trader psychology and behaviour. They're also a good record of what happened. But charts are to the market what the picture above is to ballet.
Take care and good trading!


