The support forum is built with (1) General and FAQ forums for common trading queries received from aspiring and experienced traders, and (2) forums for course video topics. How to Trade Price Action and How to Trade Forex Price Action videos are consolidated into common forums.
Brooks Trading Course social media communities
Hello experts,
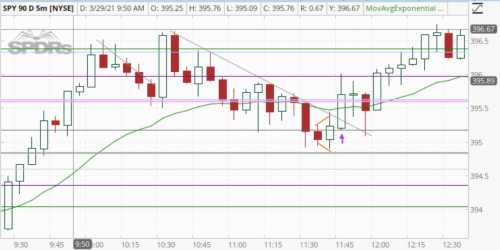
After watching at this chart for like 20 min to understand how (& where) I got the price action wrong (yes, again!), I figured, I'd seek wisdom from you folks here.
Signal 1 - Expanding triangle with a bull bar though with a longer (than I wanted to see) wick after the bar touches the downward trendline & the 20 Period EMA - Bullish setup. Go long
Signal 2 - Longer wick on the candle after touching the 20 period EMA & downward sloping trend line - Bearish setup. So, go short.
For some reason, I felt the longer wick indicated a weak bullish trend so I decided to go with Signal 2 & went short.
Then, BOOM. the big bull candle appears out of no where and BAM, got slapped! Though to be far, the trend reversed only to turn lower in the next two candles, but by that time, I got out with a loss thinking the bulls have taken control, given the size, of the bull candle bar. 🙁
What have I done wrong? Please enlighten me.
Thanks a ton.
Signal 1 - Expanding triangle with a bull bar though with a longer (than I wanted to see) wick after the bar touches the downward trendline & the 20 Period EMA - Bullish setup. Go long
Signal 2 - Longer wick on the candle after touching the 20 period EMA & downward sloping trend line - Bearish setup. So, go short.
The long is not an expanding triangle but an OU bar with a big tail, which is not great signal bar (SB) for a wedge bottom setup and BO test, and a touch of the EMA/trendline is never a bear setup unless you are in a well stablished bear trend, and here we were more likely in a PB or in a bear leg in a TR (so you were selling at the low), if you compare the strength of the move up to the high of the day with the move down to the OU bar.
In short, at this point you should have been looking to buy tho there was no good setup with stop orders (Bulls were buying every new low with limits). You could have bought the next bar closing on the high but then you were pretty high up so it was getting risky as well (like selling low, as you did).
Then, BOOM. the big bull candle appears out of no where and BAM
With what I said above, you now know that it apperead from somewhere... you were low in a TR so the Bull BO was likely.
though to be far, the trend reversed only to turn lower in the next two candles, but by that time, I got out with a loss thinking the bulls have taken control, given the size, of the bull candle bar. 🙁
When a setup is weak (OU bar), many times the SB has to be tested so once the big bull bar happened, the MKT came back down to allow bears to exit (buy back shorts), creating a BO test and then everyone bought and the MKT went higher.

