The support forum is built with (1) General and FAQ forums for common trading queries received from aspiring and experienced traders, and (2) forums for course video topics. How to Trade Price Action and How to Trade Forex Price Action videos are consolidated into common forums.
Brooks Trading Course social media communities
Hello Traders,
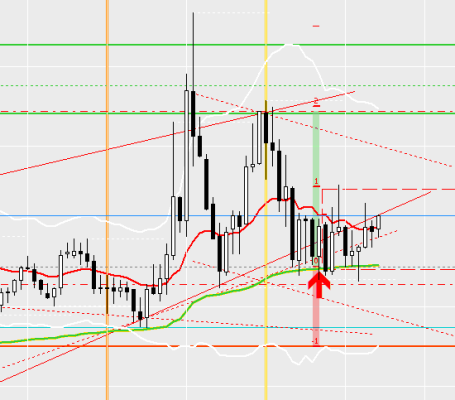
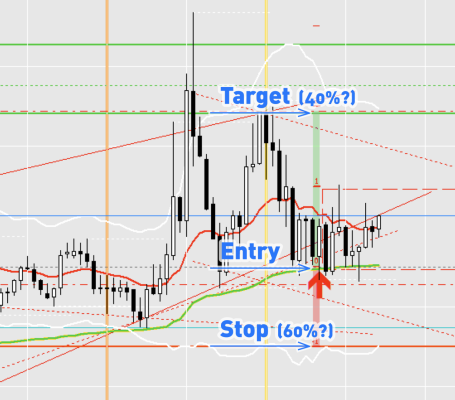
I bought this as a 2x risk/reward ratio & more than 40% probability setup.
I skipped the first exit opportunity (at 10 pips above the entry (1xIR / top of the red rectangle) & also more than 2xAR) because I thought I should wait for 2xIR to make trader's equation positive, and now it is a tight trading range, going sideways.
I think Al was saying that going sideways means the probability is getting closer to 50/50%.
According to Al, does the 40% entry now have a better probability than it did at the beginning?
Do I need to exit earlier (say 1xIR) than I was planning (2xIR), because better probability sets off risk/reward?
Or does exiting earlier mean that I am trading this position with a negative trader's equation because I am exiting the 40% trade at 1xIR? So should I hold?
Or the situation is better now because reaching 2xIR has a 50% chance? So should I hold?
If I entered with 60% setup and then PA starts to hesitate, I plan to exit earlier because trader's equation goes negative and never try to hold and manage it as a swing trade, but I'm not sure if holding in this situation makes money in long run or not.
Thanks 🙂
From my point of view it depends on your premise and if this is still valid. What was it and why you took the trade? From there you are able to evaluate what probability you have and how to manage the trade. If it is still valid you have to stay in, if it isn't you have to get out.
With more and more bards sideways it's correct that Al speaks about 50/50 in context that this leads the market to neutrality from the direction before.
The 40% probability is of getting a 1:2 RR ratio.
In TRs, the 50% probability is of getting a BO in either direction AND if you're in the middle third of the range, then there is a 50% probability that the market would reach the upper third and a 50% probability that the market will reach the lower third. The 50% probability isn't of getting a 1:2 RR.
While, you can create a positive trader's equation in the first case, it is not easy to create a positive trader's equation in a TR since the it's hard to find 1:2 RR ratio trades. That is primarily why you use limit orders and not stop orders(to create favorable trader's equation).
Per usual, it is better to BLSHS in a TR and scalp, use wide stops. If you're a beginner, better don't trade TRs.
From my point of view it depends on your premise and if this is still valid. What was it and why you took the trade? From there you are able to evaluate what probability you have and how to manage the trade. If it is still valid you have to stay in, if it isn't you have to get out.
With more and more bards sideways it's correct that Al speaks about 50/50 in context that this leads the market to neutrality from the direction before.
My premise of the trade was to buy low at the bottom of TR. Betting that bear BO of TR will fail and test the TR top.
- I saw a TR consisting of two bull legs and two bear legs late in the bull trend.
- I expected to the price go up to the previous bull leg high (last bull bar close).
- The point I bought was at bottom third of TR so it offers 2 RR ratio.
- It was on the bull trend line (red line).
- Double bottom bull flag in bull trend.
- I saw the last bear leg is strong enough to have 2nd leg down or at least its attempt. So the tight trading range / micro double bottom before the entry is acceptable to me.
- Enter after the 2nd leg down attempt of the last bear leg, which creates micro double bottom.
- I used limit order to buy at the bottom of the tight trading range, because I did not want to buy at the top of the tight trading range, which is also around 20EMA and bad RR ratio.
- Other supports were there…
I estimated the probability of getting 2xIR to be at least 40%.
Price continued to hold above the TR bottom, so yes, my premise was still valid, so I held.
But the hesitation at the TR bottom was longer than I was expected so I wondered how I should re-evaluate the probability.
My question is how the "sideways-makes-50/50" rule affects this trader's equation.
The 40% probability is of getting a 1:2 RR ratio.
In TRs, the 50% probability is of getting a BO in either direction AND if you're in the middle third of the range, then there is a 50% probability that the market would reach the upper third and a 50% probability that the market will reach the lower third. The 50% probability isn't of getting a 1:2 RR.
While, you can create a positive trader's equation in the first case, it is not easy to create a positive trader's equation in a TR since the it's hard to find 1:2 RR ratio trades. That is primarily why you use limit orders and not stop orders(to create favorable trader's equation).
Per usual, it is better to BLSHS in a TR and scalp, use wide stops. If you're a beginner, better don't trade TRs.
So there are two types of probabilities you mentioned.
A: Probability of reaching the target, here 2 RR ratio, I guess more than 40%.
B: Directional probability in a trading range, 50%.
What I mentioned about “50% in TR” is that the rule (law, effect or whatever) of going sideways neutralizes the directional probabilities towards equivalent, 50%. Let’s call this "sideways-makes-50/50" rule.
What I’m asking here is how the "sideways-makes-50/50" rule affects the probability A.
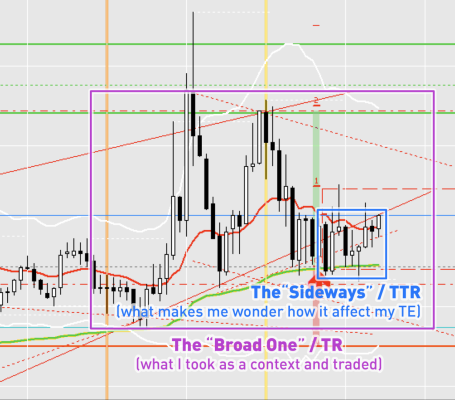
And the “sideways” I’m pointing is the tight trading range around/after the entry, bars below the EMA, and not the broad one that consisting of 4 legs.
Sorry, that wasn’t clear.
Or are you saying that the tight trading range does not significantly affect the probability A because it is only a tiny part of the TR (which provides trading opportunities)? What really matters is probability B?
Or are you saying that the tight trading range does not significantly affect the probability A because it is only a tiny part of the TR (which provides trading opportunities)? What really matters is probability B?
If you're asking if a TTR affects the probability while the market is in a TR, then no, it doesn't. Al has mentioned this at a few places that TTR inside a TR is meaningless. Both are breakout mode patterns and does not provide you with additional information.
I mentioned 3 probabilities actually. In addition to the 40% rule, I said the direction of BO while in a TR is 50-50(I'm assuming that's what you mean by directional probability).
I also mentioned that the probability that the market will reach the upper or lower third is 50% when the market is in the middle third of the TR.
This also means, that the probability is as high as 60-80% if you use wide stops that the market will reach the middle third while in the upper or lower third of the TR. That probability drops to 40% if your target is the upper third of the TR while you're in the lower third of the TR and vice-versa. Since, you don't get good signals while in the upper or lower third of the TR, that is what makes creating a positive trader's equation difficult and hence beginners should avoid trading TRs.
What remains of a TTR, if you buy high or sell low in a TTR, it is even more difficult to make money. At the same time, getting TTR after you've entered a trade does not increase your probability. That would be counter intuitive. Alternatively, if you enter a 60% probability trade and the PA starts to hesitate, then your probability stops falling towards 50%. So, you can say that if you had printed against a high probability trade, taking the 40% side, if the trade instead of moving against you, starts showing hesitation, then yes, your probability slightly improves bit it will still take about 30 bars to reach very close to 50-50.
I'm not sure if I answered your question adequately because currently yours doubts are all over the place. If you still have doubts, please form precise and crisp questions using bullet points if possible. Also, if you're interested in discussing a scenario, kindly attach a chart. That discussion would add value to this forum.
Hi R,
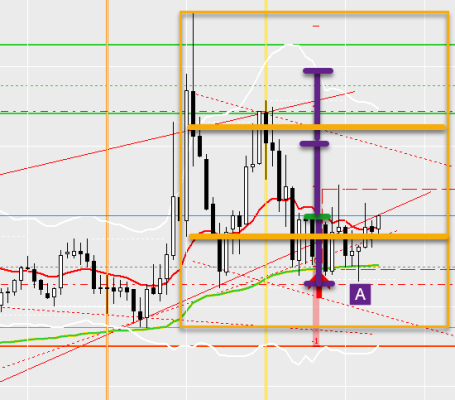
It looks like the larger pattern was a TR due to the big up and down. I'm not sure exactly where your entry was, but hopefully in the lower 3rd. If there was no strong BO yet that would pump the probability greater than 60% for 1:1 then assume it's a low probability trade and try to target 1:2. Here if you entered above the bull signal bar a 1:2 takes you to the top of TR which is OK. Although ideally you want to scalp out somewhere near the middle where probabilities of follow through often drop to 50%. That's why it pays to enter as low as possible.
In terms of management, you can either hold until stop is hit below your signal bar or manage actively and try to BE after entry bar was bear, looks like you would've been able to exit safely and look for a better entry, for example, when (A) bull bar dipped below the DB and turned up.
Hope this helps, let me know if you'd like to discuss more.
Sincerely,
CH
Price continued to hold above the TR bottom, so yes, my premise was still valid, so I held.
It's on you how you handle it from there if
the hesitation at the TR bottom was longer than I was expected
would be the best way to have a rule for it depending on time, behavior or intuition/experience.
It depends what fits you best in such situations and then to train your mind to go for it.
My question is how the "sideways-makes-50/50" rule affects this trader's equation.
From my perspective this is a time based rule, if the market needs longer than X minutes I would have to reevaluate the situation to not be biased with the PA which took place before.
Hi Abir,
Thank you for your dedicated reply and clarification. You’ve answered and addressed the topics I wanted to discuss. Here is what has become clear from your answer.
My main wonder:
Is it possible that going sideways increases the probability?
(In other words, How the "sideways-makes-50/50" rule affects the trader's equation? or Is getting TTR after you've entered a trade does increase your probability?)
What makes me wonder:
The counterintuitive logic.
If the sideways makes a 60% trade drop to 50%, why not a 40% trade up to 50%?
(Where the hell is the 10% going? Probability of never reaching the stop or target forever?)
Why I’d like to figure out this:
Gaining a better understanding of what Al’s talking about.
(Maybe maybe maybe there is no need to consider this agenda as long as you are satisfied with your profitability. However, I would still like to know more. I just believe that gaining a better understanding of Al will make a trader better.)
At the same time, I see two points that unclear and seem to contradicting so I would love to know more what you mean by that.
1. “Getting TTR after you've entered a trade does not increase your probability” VS. “your probability slightly improves”
At the same time, getting TTR after you've entered a trade does not increase your probability. That would be counter intuitive. Alternatively, if you enter a 60% probability trade and the PA starts to hesitate, then your probability stops falling towards 50%. So, you can say that if you had printed against a high probability trade, taking the 40% side, if the trade instead of moving against you, starts showing hesitation, then yes, your probability slightly improves bit it will still take about 30 bars to reach very close to 50-50.
So, are you saying basically YES to my main question?
2. “TTR inside a TR is meaningless” VS. TTR affects your trade probability (the point 1)
If you're asking if a TTR affects the probability while the market is in a TR, then no, it doesn't. Al has mentioned this at a few places that TTR inside a TR is meaningless. Both are breakout mode patterns and does not provide you with additional information.
So, are you saying TTR affects your trade probability in usual caae, but not like this particular case such as in a TR?
(By the way, I was not asking this. I just wanted know what did you mean by the first reply. But very helpful. And if it is possible, would you kindly tell me where did Al mention this? I have the 4 books as well)
Also, if you're interested in discussing a scenario, kindly attach a chart. That discussion would add value to this forum.
Sure, I'll look for other examples! Give me a time:)
Let me reply to you guys first. It took me a day😅
Thanks again.
Hi Mr. Carpet,
Thank you for providing the chart and a fresh perspective to me.
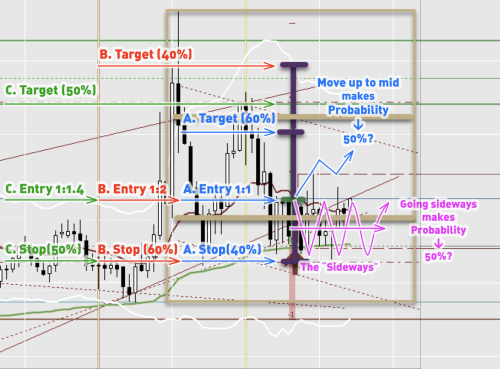
I attached the image to clarify my entry.
Here is what I'd like to disscuss:)
1. How low the probability of 1:2 trade is? Less than 50%?
assume it's a low probability trade and try to target 1:2. Here if you entered above the bull signal bar a 1:2 takes you to the top of TR which is OK. Although ideally you want to scalp out somewhere near the middle where probabilities of follow through often drop to 50%.
For me, the 1:2 entry has less than 50% probability since opposite trade seems to have more than 50%. Here I assume over 40%.
What buzzing me in this situation is, it feels like the probability “drop” to to 50%, but the logic tells me that probability gets “higher” to 50% from 40%.
(Everything makes sense if the 40% assumption (less than 50%) is WRONG. Only if my entry has more than 50% to reach a 1:2 target does everything make sense. I know it is unlikely to happen, rare situation. However, it doesn't mean it will never happen.)
2. About the management
Although ideally you want to scalp out somewhere near the middle where probabilities of follow through often drop to 50%.
Sorry, I think I'm not understanding what you're trying to say.
Which trade are you talking about?
A. 60% / 1:1 Trade (Blue on the image below)
B. 40% / 1:2 Trade (Red)
I assume it’s A. And the 60% drop up 50%.
But isn’t that taking 50% trade with less than 1:1 negative trader’s equation?. So I wonder if that management is ideal. If I had to, like consecutive bear bars appear and each bar has a decent body without tails below, I DO get out no matter how negative the TE is.
3. My main question.
What I wanted to ask in this thread is how the “Sideways” (Pink) after the entry has impact on my probability of reaching the target.
I guess if the pink movement happen, the "sideways-makes-50/50" rule should affect on probability of my trade in somehow. And If I entered the Trade A, I see probability goes from 60% to 50%, which is logical and making sense intuitively. Trade B should go from 40% to 50%, but my intuition is yelling me that doesn't make sense.
So I’d love to know how I am misunderstanding / making wrong assumption / or just market can do very counter intuitive trick like this.
[NOT RELATED TO THE MAIN TOPIC]
4. C, the 50% / 1:1.4 Trade (Green)
Discussion with you makes more questions! Thank you for giving me those insights and opportunities to study market 🙂
The 2 trades A and B makes me think about the trade C. Let’s assume the both A and B trades have about same profitability in end of 1000 trades, so you can just pick whichever you want. If these two provides the same expected value, trader’s equation (here both 0.2), those trades with having target in between two of them should have same result.
This is a magical position, as it seems that NONE OF TR PRICE ACTION influences its probability.
Just another non-understandable example.
P.S. I love the purple A trade example you gave me. I would definitely take that.
Hi Hubert,
would be the best way to have a rule for it depending on time, behavior or intuition/experience.
Thank you for giving me another view point. The time aspects.
And yes, I agree with all what you’ve mentioned 🙂
I usually start to think about BE exiting if the price doesn't move for long time more than I expected, as I did in this particular trade. And I'd like to talk about how I should see this case.
Sorry for repeating this, but again, I'm wondering HOW TO REEVALUATE in this particular case exactly.
How to I take those TR price action rules and use them for the assessment?
If it goes sideways longer than expected, means probability is more likely to be around 50%. If so, I have to REEVALUATE as the my 40% entry with counterintuitive logic.
So I’d love to know how I am misunderstanding / making wrong assumption / or just market can do very counter intuitive trick like this.
Thank you!
Hi R,
That's a lot of questions to address all at once 😀 Actually, I think it's important to first clarify how you're estimating probabilities. Maybe I'm wrong so please correct me, but it sounds like after selecting a point on the chart you're measuring the distance to your stop and using that as 1R of 60% chance, then doubling that up and using that as 2R of 40% chance of profit?
Hi R,
A funny thing about price action that goes sideways for too long, is that if your original entry was for a 40% chance, for example, then after enough sideways it raises to 50%. The sideways action actually improves your trade in that case 🤗 It makes sense because if it was originally a high probability for traders betting against you but after some time it's not working out for them that means their probability is decreasing, but yours is increasing (a little).
I believe Al mentioned that sideways has to go for a very long time though, such as 20 bars or so to reduce the influence of the prior price action on the directional probability of the coming breakout.
Hi Mr. Carpet,
I know I keep confusing you guys with long wordy posts😂
My question I care the most is always in the topic title.
Other questions are either guides to try to help us get to the answer, or to see if I'm on the same page as you!
it sounds like after selecting a point on the chart you're measuring the distance to your stop and using that as 1R of 60% chance, then doubling that up and using that as 2R of 40% chance of profit?
Well... I use TE: 0.2 as a ruler to measure how realistic my trade is. Only if the PA tells me that the TE I'm evaluating from the market is realistic in the situation, I will take that trade. As a beginner, I become suspicious when I'm aiming for that seems too good to be true, like 1:2/60%, 1:1/80%, or too bad.
BUT THE POINT IS why I put the chart is just wanted what you were talking about in the last reply. I don’t estimating probabilities in that way.
A funny thing about price action that goes sideways for too long, is that if your original entry was for a 40% chance, for example, then after enough sideways it raises to 50%. The sideways action actually improves your trade in that case 🤗
And thank you for the answer, THIS IS IT! this is what I wanted!!!
So, are you saying basically YES to my main question?
It appears that at least this part of my answer had a major typo, so much so that the grammar does not even make any sense. Let me rephrase this part for you.
If you take a 60% probability trade, that is a scalp class trade, so you shouldn't usually have to wait too long before the trade moves in your direction. So, yes, if the PA starts hesitating, starts getting PB or even enters a TTR, there is for sure something wrong with the premise. That's the market telling you, that the probability is not as high as you thought. However, the probability drops to about 50% only after 30 bars or so(Al's words). I don't recall seeing a 60% probability trade get a 30 bar TR as of yet but it might be possible. Usually, the trade will get some kind of a decent reversal pattern and start moving against you.
Alternatively, if you bet against a 60% probability trade(NOT RECOMMENDED), and the PA starts hesitating, enters a TR, then yes, the probability starts falling. Like I said before, it takes 30 bars or so though for the Bulls and Bears to have roughly equal probability.
So, are you saying TTR affects your trade probability in usual caae, but not like this particular case such as in a TR?
Yes. That is what I'm saying. You see, a TR is already a 40% probability proposition. So, you have both bulls and bears getting 40% probability in their respective areas and respective conditions. So, the question of a TTR affecting an already low probability does not arise. However, the TTR could be an indication of buying or selling pressure under right circumstances. Check out the encyclopedia and you'll see what I mean. One example would be, 5 bull dojis all above the moving average is an indication of buying pressure and makes a bull BO more likely than a bear BO.
However, this is an off-topic discussion meant to be discussed elsewhere.
Hope this clarified all your present doubts.
