The support forum is built with (1) General and FAQ forums for common trading queries received from aspiring and experienced traders, and (2) forums for course video topics. How to Trade Price Action and How to Trade Forex Price Action videos are consolidated into common forums.
Brooks Trading Course social media communities
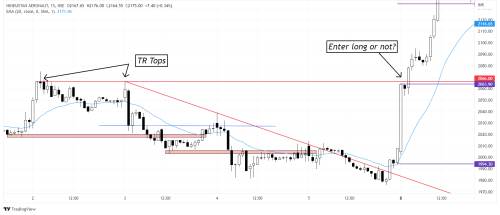
As you can see in the image; bear trend is weak because of pullbacks overlapping BO points after bear BO and not many consecutive bear trends bars. So after the huge bull BO mkt is AIL, but I am concerned about the tops to the left.
My question is:
How do you decide that the mkt is actually in a bull trend and not just a bull leg in TR? And, how would you trade the scenario, that is; what conditions will make you go long and what will make you short the mkt?
There’s a few reasons to think this might break out:
- Bear channels are bull flags. They usually break to the upside
- The stairs pattern in the channel is weakening; each breakout below the prior swing low in the bear channel was less than the previous breakout
- The daily and weekly charts are in a strong bull trend.
- There’s an open gap with the prior swing high on the daily chart.
- The move happened on the open so probably sustained buying and trend resumption rather than vacuum. (Traps can happen on the open but the context seems right for a continuation rally here)
- The move originated from an area of support (yesterdays close, moving average - an ideal place to buy on the open)
- Prior day (last day of week) ended with a buy-the-close finish: weekly chart traders bought the market into the close. (they were glad of a discount and concerned about missing-out because of a gap up this week)
- The bar broke above 4 days of price action and lots of bear stop locations on several timeframes.
It is a huge bar on this timeframe so big risk. Buying above the second bar would be reasonable. It’s red but closes above the midpoint and is a H1 - a bull flag on smaller timeframe. Higher probability would be to wait for the follow through bar 3 with a stop below the bull flag (bar 2).
If I saw this bar racing up I’d probably switch to a smaller timeframe and buy closes.
Thanks for your detailed answer

