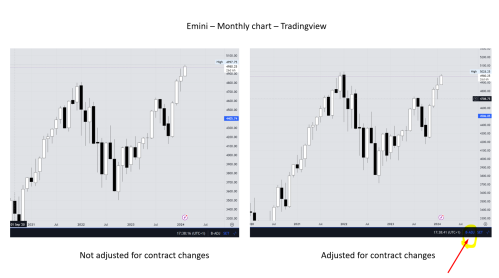
The support forum is built with (1) General and FAQ forums for common trading queries received from aspiring and experienced traders, and (2) forums for course video topics. How to Trade Price Action and How to Trade Forex Price Action videos are consolidated into common forums.
Brooks Trading Course social media communities
Unadjusted creates artificial gap and skews the price action so we always trade adjusted.
You have to understand what happens when a chart is adjusted to include data from more than one active month. At the rollover, the difference between the contracts is removed from the older data to eliminate the gap. This means that all the older data will be higher if the market is in contango (like now) or lower if in backwardation. That gap in unadjusted charts shows the actual price difference between the months at the rollover. Currently the June contract is trading about 57 points higher than the March contract but that will change as time elapses. That adjustment is why old Hs and Ls no longer reflect where the market was actually trading at that time and is why I prefer to use cash charts whenever possible for longer term analysis since they show real prices throughout.
Thanks a lot Andrew, let me ask you:
By cash chart you mean the SPX symbol? Please let me know otherwise. And, between the two charts of the Emini that I posted, I assume the non-adjusted reflects more accurately the real price? Then we are in all time highs I guess.
Thank again.
Regards
SPX is the symbol for the S&P 500 cash published by the CBOE. Some trading platforms use other symbols. A non-adjusted chart with its funny looking gaps will show where prices really were at that time. An adjusted chart will show prices that do not reflect where the market was. Here is an example. My daily day session adjusted chart shows the prior all-time high for ES futures on 1/4/2022 as 4868.25. If you go back to the chart Al made on that day you will see the market was actually quite a bit lower. Emini-new-all-time-high-and-spike-and-channel-bear-trend-after-low-2-top.png (1920×1080) (brookstradingcourse.com)
I find this confusing. Adrew A (Another Andre I suppose), posted a weekly and monthly review recently here: https://www.brookstradingcourse.com/analysis/emini-test-all-time-high/
This chart looks similar to the adjusted chart. I also think I remember Al showing we were not yet above the all time high, last thursday.
Would you say, we actually already are making new all time highs?
It is confusing and the issue is an ongoing point of disagreement among traders. This article goes into more detail. Roll em! How to calculate futures rolls (and why you care) • The Blog of Adam H Grimes
Good to know. Thanks for the article!

