The support forum is built with (1) General and FAQ forums for common trading queries received from aspiring and experienced traders, and (2) forums for course video topics. How to Trade Price Action and How to Trade Forex Price Action videos are consolidated into common forums.
Brooks Trading Course social media communities
Hi,
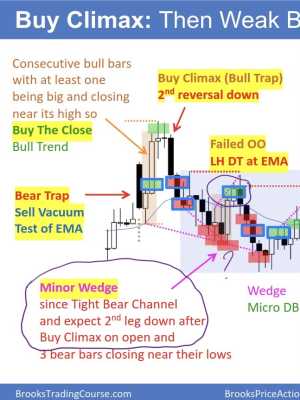
Here the text said "Minor Wedge since Tight Bear Channel and expect 2nd leg down after Buy Climax on open and 3 bear bars closing near their lows". That doesn't sound like a best buy but it was marked so.
Am I misunderstanding something? Can someone please help me clarify please.
Thanks in advance!
It is still a DB on the open with the second leg being a wedge and bull bar closing on the high for signal bar, so swing buy. Most swing entries have problems and that is the reason why they are low probability. If you didn't like this one, ok to let it pass and wait for the next one!
Thanks @ludopuig
Most swing entries have problems and that is the reason why they are low probability
This recalled me to what Al wrote in his Trading Range book - Math section.
"To trade a low probability system, you have to take every strong signal, because if you cherry pick, you will invariably pick the wrong cherries, and will often miss that one great trade that you need to overcome your earlier losses"
So this does relate to how this one is a best trade a beginner should take.
Most swing entries have problems and that is the reason why they are low probability
I guess this relates to the "there's always an argument for the bulls and the bears" thing, is that right?
Am I correct in interpreting your statement as "some swing entries have little to no problem"?
And when they do have "little to no problem" does it increase the probability of the swing trade? Or all swing trades are equal regardless of little problem or not?
This one question might not really have an answer but what do you think of the percentage of occurrence of the swing trades that got problems vs those that just look really good? something like 80% vs 20%?
Many thanks for your time!
This recalled me to what Al wrote in his Trading Range book - Math section.
"To trade a low probability system, you have to take every strong signal, because if you cherry pick, you will invariably pick the wrong cherries, and will often miss that one great trade that you need to overcome your earlier losses"
So this does relate to how this one is a best trade a beginner should take.
Yes, you have to just focus in a pattern of choice and try to take it when you see it.
Most swing entries have problems and that is the reason why they are low probability. I guess this relates to the "there's always an argument for the bulls and the bears" thing, is that right?
Yes, when everything is clear, there is a BO (less than 10% of the time).
Am I correct in interpreting your statement as "some swing entries have little to no problem"?
Yes, but good patterns come very few a day.
And when they do have "little to no problem" does it increase the probability of the swing trade?
Yes, good swing buys can be as high as 50%.
This one question might not really have an answer but what do you think of the percentage of occurrence of the swing trades that got problems vs those that just look really good? something like 80% vs 20%?
The best swing trades are marked with blue-rectangles in the daily setup section. Those trades are BOs, PBs or reversals. Depending on what trades you lean towards, you will see more or less problems in each of those types.
Take yesterday as an example: Bar 1 and 2 are a very clear BO, but they are scary (= huge risk) while bar 7 (PB) might look safer to you if you want to put your stop just below, reducing your probability accordingly. For me, bar 23 HL DB (reversal) is the best looking trade but only because the risk is smaller than in the previous trades and it is a DB at EMA with bull bar closing on the high, so I thought it was a 50% swing buy with a first profit target (high of day) twice the risk (22L) and a second profit target (DB MM) much much bigger. Those are the trades I look for during my trading time (the first 3 hours of the session) but you could be more confortable taking bar 24 BO from the 23 DB (increased probability and risk) or any other of the BOs (1C, 2C, 11L) and PBs (7H, 15L) trades that came.
So, what is best for you? Decide your preferred mix of probability and risk/reward and count the trades among the blue rectangle trades that would qualify "for you" as best trades, and then count the total number of trades that Al marked, and divide to get the percentage!
I've gained more clarity now. Thanks a lot!
Hi @ludopuig
I've like to follow up with this thread because I saw a similar setup yesterday.
It is still a DB on the open with the second leg being a wedge and bull bar closing on the high for signal bar, so swing buy.
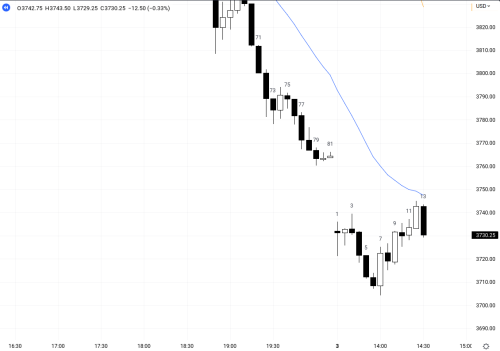
Yesterday bar 13, I saw it similarly as a DT on the open with the second leg being a wedge 7 10 12 and a signal bar closing near its low. It was also at EMA.
I saw the move up was pretty tight but there is no perfect trade and as you said:
Most swing entries have problems and that is the reason why they are low probability.
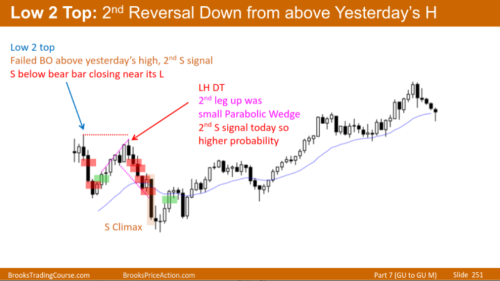
Plus, I've seen tight channel not being a factor to eliminate this setup. For example, here on this slide on the Encyclopedia:
Therefore, I thought it was a reasonable swing sell, probably even deserve a blue border box like the chart on the original post (2022-08-31), or at least a red box.
Therefore, when I reviewed the end of day markup up chart by Al, I was surprise to see that this sell was not mark.
It got a bad entry bar that trap bear in and the trade resulted in a loss but so does the chart on the original post.
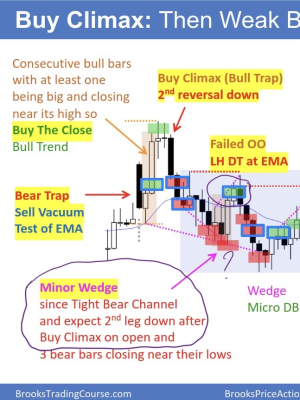
I'd like to re-post the chart on the original post to make it easier to follow:
If you don't mind, can you share with me your thoughts (process) on this trade? Thanks in advance.
Yesterday bar 13, I saw it similarly as a DT on the open with the second leg being a wedge 7 10 12 and a signal bar closing near its low. It was also at EMA.
Yes, the setup looks similar, but...
Therefore, I thought it was a reasonable swing sell, probably even deserve a blue border box like the chart on the original post (2022-08-31), or at least a red box.
Therefore, when I reviewed the end of day markup up chart by Al, I was surprise to see that this sell was not mark.
... the context is different.
In your first chart, the day before was a sell climax day, so having another bear day was a low probability event and a move sideways to up for several hours was high probability. Yet, bears tried, 3L, but got instead a sell climax with huge outside up bar, 7, that was the second failed BO below yesterday's low, so from there onwards, the MKT went AIL and the move was up and the sell at 13 was LP.
In your second chart, DT 13 was a second failed BO above the prior day's high and bar 6 didn't switch the MKT to AIL, so it was an ok sell. It was like 7 in your previous chart, but for the bears.
The above was related to the context, but now looking at the setup you can compare the bull bars in your first chart, big compared with the bear bars, and the bull bars in the second chart, small compared with the bear bars. Yes, all of them closed on the high, but in the first chart the bars are bigger compared with their bear counterparts, the move up was stronger, and not so in the second.
Hope it helps!
That really helps! Thanks ludopuig.
It’s amazing that seemingly similar pattern can be really different when looking deep enough and considering context.


