The support forum is built with (1) General and FAQ forums for common trading queries received from aspiring and experienced traders, and (2) forums for course video topics. How to Trade Price Action and How to Trade Forex Price Action videos are consolidated into common forums.
Brooks Trading Course social media communities
Hi, everyone
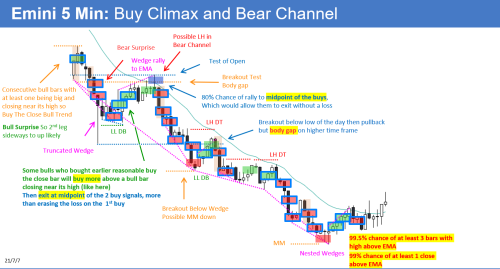
This is my first post here. I'd be very happy if you guys could comment and give me some feedback on this daily report I made (study purpose), especially since Al hasn't posted his daily report of yesterday (5th December) yet. Feel free to say anything, all suggestions are welcome. I'm interested in anything anyone has to say.
Thank you
Hi Alan
I had bar 1 as not a buy and bar 3 as a sell, because, to me, b1 is too unreliable (as the opening bar), b2 weakened the buy case, and b3 (bear trend bar) disapointed the bulls while attracting many bears. Not that b1 was an unreasonable buy. 😀
I thought this day was a very good stop-order swing day - sizable bear swings, relatively easy to exit bull swings at at least breakeven, stayed on one side of the EMA, and only had one sustained sideways phase, except for the usual EOD profit taking.
Nice work Alan. My only comment is also about bar 1, like @Graeme. On my chart, bar 1 does not look big enough to constitute a Buy the Close with bar 2. Perhaps some others can comment on this. -Thanks
Fully agree with everything you said and I also thought bar 1 might not be a reasonable buy. There's hindsight benefit in this analysis, it was clear to me that some bulls bought above buy 1 (or even the bar 2 close), scaled in lower (by buying above bar 11 which was a reasonable buy in my opinion since it was a bull bar closing near its high, but you can consider bar 13 and the result will be the same) and got out breakeven at midpoint of the buys (we can see some profit taking at bar 16, exactly midpoint of the bulls who bought bar 1 and scaled in above bar 11. There's also some profit taking at bar 19 and 21 which were midpoints of the bulls who bought bar 2 close and scaled in above bar 11 as I wrote on the chart.
Thanks for the reply
Just answered @Graeme. See what you think about it. Thanks for the reply
Great Alan, I make the report myself also everyday (day after), it's the best training you could do imho.
My take is the Measured Move is the HoD to the DB (bar 7 - bar 26, followed by the BO with follow-through on bar 29), that leads exactly to the LoD. The BO (bar 53) below the wedge (bar 48), also leads to the same MM (from H of that wedge, bar 35).
Regarding bar 1, "gap down, big bull bar on the open" has only a 30% chance of LoD (in other words, 70% chance it'll go lower)
My 2 cents. Keep up the good work!
Good job, @Alan C., keep improving your reading and you will find yourself on the right track.
Just one point that strikes me is the number of blue-rectangle trades you pointed out. If you compare with Al's, you highlighted too many of them: blue-rectangle trades are intended to be the best trades and, by definition, they should be a handful per day, not more. If not, that is to say, if most trades have blue-rectangle, there is no point in marking them. Rather, if you actually choose the very best trades and concentrate on taking them daily, your trading will improve.
Completely agree with you. I noticed that too, too many blue-rectangle entries. I will work on it. Thank you
You're 100% right about the measured move, I only saw it after I posted it and while I was checking again, but decided to leave at it since it was already posted and I didn't feel like deleting and posting it again. But I'm glad someone noticed it, very good attention to details. I didn't remember that rule ("gap down, big bull bar on the open" has only a 30% chance of LoD) but I will definetly remember from now on. Several times I see a big gap down and big bull bar on the open and treat it as a 'sell climax' and good buy opportunity but that's definetly not the case after being aware of that rule. Thank you for your input.

