The support forum is built with (1) General and FAQ forums for common trading queries received from aspiring and experienced traders, and (2) forums for course video topics. How to Trade Price Action and How to Trade Forex Price Action videos are consolidated into common forums.
Brooks Trading Course social media communities
Hey guys,
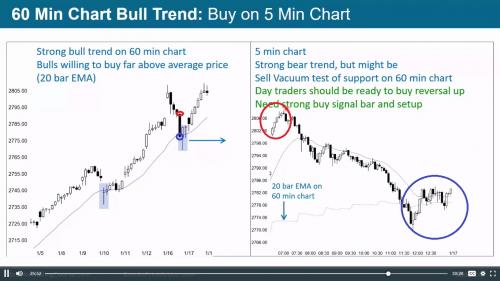
I guess there is a misinterpretation of the day al showed on the 5 minute chart on the slide below. Look:
I guess the day presented on 5 minute chart is the big bear trend bar. You can relate the tails with the minor reversals like I highlighed.
The day circulated in 60 min chart should have opened below and closed above, the exact opposite of what is happening on the 5 min chart.
Am I correct?
Thanks in advance.
Hi Fabio,
That big bear trend bar is just one 60 minute bar, not the full day.
The 60-minute chart shows several days of action and the corresponding bars for the 5-minute chart (one day's worth) are the 7 60-minute bars down from high. If you count out 12 bars on the 5-minute chart for each of the 7 60-minute bars you should be able to see how they match up fine.
Your 5-minute red circle covers about the first 30 minutes from open, after which market fell to give the 60-minute tail on top. Your 5-minute blue circle covers the last 90 minutes or so.
Does that help?

