The support forum is built with (1) General and FAQ forums for common trading queries received from aspiring and experienced traders, and (2) forums for course video topics. How to Trade Price Action and How to Trade Forex Price Action videos are consolidated into common forums.
Brooks Trading Course social media communities
So lets assume we have a situation where we have a trading range that's kinda young and the borders are not that clear.
Price moves down and does not strongly reverse up.
So you wait. You can't buy because it lacks bull strength for a reversal but you can't sell either because we are at the bottom of a range.
It shows some strength from the bulls several times but not enough.
The volatility increases which makes you think it reverses but it doesn't (<- i struggly with this especially, in many other situations as well).
It continues to go down, reversals are not strong enough and at some point it becomes *painfully* obvious that we have left the range a while ago.
It's not even a expanding triangle anymore since we have move past this point.
Now i sell and that's a mistake because just now it will reverse up strongly.
How do i think to manage this?
What is going on that explains this behaviour?
Do i think trading range?
Do i think trend with climactic ending?
Do i think weak trading range breakout with measured move target?
Thanks and have a nice day 🙂
You can't buy because it lacks bull strength for a reversal but you can't sell either because we are at the bottom of a range.
You can sell because you are in a small PB bear trend, yet this trends are very difficult because the risk is big and it seems the MKT is about to turn at any moment, so it is easy to make mistakes. The easiest thing? If you didn't sell any of the bear bars COL (closing on the low) during 1-2 or 4L... doing nothing is the best thing to do.
How do i think to manage this?
What is going on that explains this behaviour?
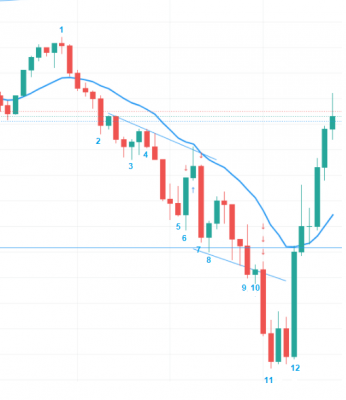
In the chart you attached, the MKT went AIS during the BO 1-2 (below) so at least you knew you would get a second leg down and you could sell for a swing any of the BO bars. This second leg down could have ended at 3, but the channel down was a microchannel coming from a wedge so it seems it could be actually the first leg of a more complex correction. Because it was in the lower half of the range, eagers bulls could buy but they had to exit at 4 COL and another BO followed down to 6. 6 is at the bottom of the TR but it is also in a small PB bear trend so as long as bulls do not create a setup or a BO the MKT will go lower.
6 is a micro DB after a climax 4-5 but there was not prior bull strength at all, the channel down was very tight (low probability for the bulls) and the SB (signal bar) was big (= big risk), so low probability and big risk makes a bad trade and therefore better to wait for a second signal or a BO.
8 was that second signal with a good SB but it was preceeded by 7 which was kind of a surprise (it could represent 6H bulls exiting, in which case they would not buy just below). Because it was at support (if your blue line is support) I think you could take it but better to wait for another signal if you wanted higher probability.
10 was a wedge but the SB was tiny and followed by 4 bear bars, so still LP. The MKT broke below the Wedge but the BO down to 11 had the two best bear bars in a mature trend so the probability of a climax and two legs and 10 bars correction was high, so you couldn't sell down there.
Finally bulls got a micro DB and then a BO 12 that made the MKT AIL, so you could buy anywhere within the BO (like 1-2 for the bears) expecting another leg up (at least).
Hey Sascha, love your question. And in my opinion you need to consider first that if you have been in a TR on the 5 minute chart for more than 30 Bars that there is a good chance of a BO. And the way this chart looks, it was 3 pushes up and looked somewhat like a DT. The key I think is the 20EMA and with the first 2 bears bars finishing on or near their low, then I would be considering a trade, waiting for confirmation of breaking the 20EMA and a Moving average GAP BAR. This is further confirmation of a trend change. My first thing to do then would be to take a ruler and plot a first MM from the top of the TR to the BO point. After this I would see how the bars are forming. And as they seemed to sell off without any pull back it would start to look good for a second leg down. And also at this stage is well below the 20EMA. So looking great for continuation of the Bear trend down. I would then be counting the wedges and noticing the size of the bars. Note the Bull Back to the 20EMA. I would have already looked at 1 Leg and then measured the second leg. It was after this trying to retest the BO point as it moved the the 20EMA. It then sold off again. Notice the biggest Bear Bar in the whole bear trend which is parabolic climactic. Then I would pretty much feel the move is over and looking to take profit. (I am also a newbie 65 days into studying the course and have completed both video series, and now trying to learn more from following the Facebook study group, and the encyclopedia which is awesome. Hope this helps. Its less technical than Ludo as he is one of the Masters here.


