The support forum is built with (1) General and FAQ forums for common trading queries received from aspiring and experienced traders, and (2) forums for course video topics. How to Trade Price Action and How to Trade Forex Price Action videos are consolidated into common forums.
Brooks Trading Course social media communities
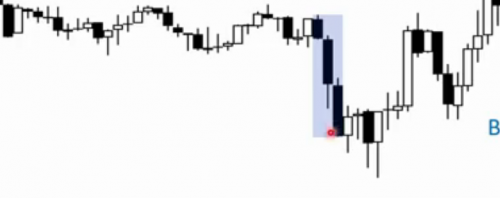
Al oftentimes says when there is a strong move (e.g. 3-4 bars down) it's a narrow channel hence there is high probability it will continue with at least one or two legs. However, the same strong move is also a climax, as he says in this video, and therefore it's 50/50 chance it will either resume or reverse. So how would I sync up the two ideas? Thanks
Every trend bar is both a BO and a climax so you need the context to choose in each case. Not possible to summarize here all possibilities but, in general, if the streak of bars happen after a trend has gone for a while or at the top of a TR, more likely it is a climax than a BO. But, as always, each chart has its subtleties so better to post a chart and discuss it than talk in abstract terms without an example so, next time you can't decide, post the chart so we can have a look on it!
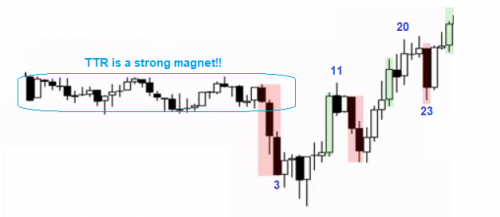
Yes, all trend bars are both BO and climaxes but, in order to make sense of them, you need to do the bar-by-bar analysis:
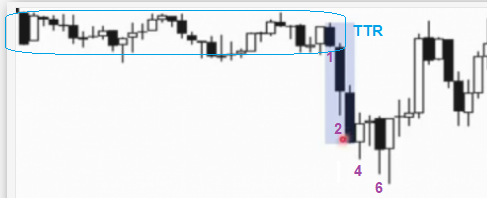
* Before bar 1 there is a protracted TTR which is a strong magnet. If it is preceeded by a down trend, a TTR many times become the final flag and, if this was the case (we don't know) you could be prepared for the BO 1-3 to become a climax. Anyway, TTRs are strong magnets no matter what so the BOs from them usually are tested: 3 is the bear BO and 11 the BO test (that failed) and 20 is the bull BO and 23 the BO test (that was successful).
So about the bear BO, the bar-by-bar analysis:
* Bar 2 is consecutive bear bars so at this moment you have a BO and can sell.
* Bar 3 closed on the low so good FT and, at least, you will get a second leg down. This is a higher prob sell.
* Bar 4 tried to turn the BO into a climax but the size was small compared with the 3 consecutive bear bars and had a tail above, so bears didn't exit.
* Bar 5 is a L1 but doji so bad SB for the bears but also bad for the bulls.
* Bar 6 is the attempt from the bears to keep trending but had a big tail below and closed above 4L. With the strong magnet above, not good for the bears.
* Bar 7 ended the second leg down and created a fantastic DB so bears had their two legs and exited turning at this moment the BO into a climax.
So, as you see, you were right and bars 1-3 were a BO until they became a climax at bar 7. When studying a chart, always do the bar-by-bar analysis because in hindsight things usually are clear but we trade in real-time so we have to try to see and study the chart also as it happens to make sense of it.
Wow, thanks for the detailed analysis ludopuig. It was truly outstanding. I was interested to see how this topic turned out.
On a related note, could you please elaborate on the L1. I am seeing this L1 and H1 appear a lot, in bar-by-bar analysis on the BPA EOD report but can't make much sense out of it. It appears that the traditional H1 and L1 that I learnt in BTC so far, is not the case here. It seems a bit different. Could you please explain that a bit more?
Also, could you please explain the probability of the buy after that micro double-bottom on bar 7? Is it a swing buy with 40% probability or a scalp-worthy trade with a probability nearing 60%?
Thanks!
It appears that the traditional H1 and L1 that I learnt in BTC so far, is not the case here. It seems a bit different.
They are absolutely the same, only one kind of L1/H1 🙂 What makes you think they are different?
Also, could you please explain the probability of the buy after that micro double-bottom on bar 7? Is it a swing buy with 40% probability or a scalp-worthy trade with a probability nearing 60%?
Reversals are always LP, the best ones can reach 50%. I think this is one of those, especially if the TTR was a final flag and the reversal took place at some kind of measured move.
They are absolutely the same, only one kind of L1/H1 🙂 What makes you think they are different?
There are instances when I am seeing Al mark a certain bar as L1 and H1 even though the price did not yet cross the high or the low. I am getting confused because of that. 🙁
Is it because he is expecting the price to do so?
For example, on this link - Al Brooks Bar By Bar (brookspriceaction.com) he is already seeing a H2 on the 3rd bar. I cannot, for the life of me figure out a H2 on the 3rd bar.
Reversals are always LP, the best ones can reach 50%. I think this is one of those, especially if the TTR was a final flag and the reversal took place at some kind of measured move.
Almost forgot to thank you for your response. Thank you for the clarification.
There are instances when I am seeing Al mark a certain bar as L1 and H1 even though the price did not yet cross the high or the low. I am getting confused because of that. 🙁
Is it because he is expecting the price to do so?
Nop, he does not expect so but a bar is a H2 candidate anyway. Only if next bar goes above it becomes an actual H2 but you need to label it before this happens because you have to take action when the H2 actually triggers going from candidate to actual H2.
For example, on this link - Al Brooks Bar By Bar (brookspriceaction.com) he is already seeing a H2 on the 3rd bar. I cannot, for the life of me figure out a H2 on the 3rd bar.
I think the confusion comes because a DB is a type of H2, and an ii is a type of DB, so 3 is a H2. The key there is, no matter how you name it, to realize that the MKT is in Breakout Mode.
Thanks for the wealth of analysis, ludopuig!
Nop, he does not expect so but a bar is a H2 candidate anyway. Only if next bar goes above it becomes an actual H2 but you need to label it before this happens because you have to take action when the H2 actually triggers going from candidate to actual H2.
Yes, that makes a lot of sense. I did not consider the real-time trading perspective. That should clear it up I think.
I think the confusion comes because a DB is a type of H2, and an ii is a type of DB, so 3 is a H2. The key there is, no matter how you name it, to realize that the MKT is in Breakout Mode.
Yes, that was abundantly clear. With those IIs at bar 3 and then the OOs on bar 5 followed by the triangle, it was very clearly in a BOM.
Thank you for taking the time to clarify. It was very helpful.
ludopuig, if looking at the sequence of bars 4,6,7 (5 is skipped as only a doji) with lower high and lower low, one might say bear is still trending. What do you think of that? Or does the slop connecting the highs have to angle further to be evident of the bear?


