The support forum is built with (1) General and FAQ forums for common trading queries received from aspiring and experienced traders, and (2) forums for course video topics. How to Trade Price Action and How to Trade Forex Price Action videos are consolidated into common forums.
Brooks Trading Course social media communities
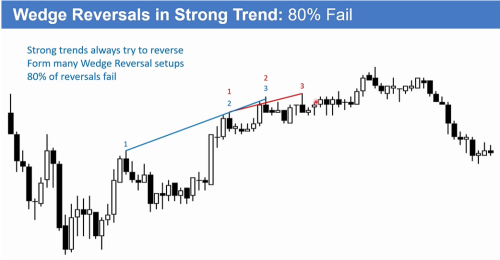
In this chart, we're learning not to sell wedges in a strong trend. Al is using this chart to show that there's a strong trend, pointing to the first push up, which continued to the second and third push up. This formed a wedge with not much selling pressure, only a small pullback of one or two bars (I agree).
However, based on what I learned from MTR videos, Al mentioned to look at the left bars. If bears are strong enough to cause big bear bars, they might sell again for a reversal, leading to a MTR. Considering this, shouldn't traders also be inclined to sell at the first push up area or second push area, assuming it might also be forming some kind of double top ( I acknowledge that those push up have a strong bull bar and we may get at least a small second leg up which did occur at point 3)? Also, the big down and big up suggest trading range price action, and selling at the top of the trading range would also make sense.
In summary, why should traders avoid selling at the wedge top here, given the context of the huge bear bars on the left? What information can traders gather from the first few large bars at the beginning of the chart?
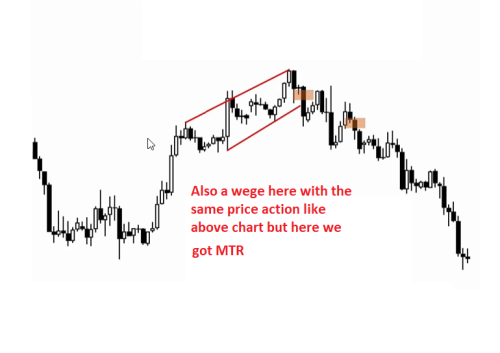
This is one more chart to consider for the same question I am asking above to contrast a difference.
In the "Wedge Reversals" chart, the first two big bear legs look exhaustive, meaning that bears would not want to sell again soon.
Other than the big bear legs, after points 2 and 3 (green), the follow through after the bear bars is not good. You can compare the follow through with the second chart you posted to see the difference.
Also, on the second chart you posted, the bear leg at the beginning is only one leg and not as exhaustive, so bears might be ready to sell for an MTR.
I hope that helps.
Also on the first chart, if you draw a trendline from the last big move down to create a channel, the reward is not worth the risk to make a sell. Additionally, the bulls left a gap in the chart from the first big bull bar. You should be thinking that more than likely, because there were three pushes down before the bulls took over that the bulls will only allow the bears to close the gap before price moves back up.
And like Ryan said, the first chart is the beginning of a move and the second chart is the end of a move. Now going back to the first chart, the big bull bar right before point 2 is a spike. The bars that follow create a channel. So now you have a spike and channel. After you draw your channel, you should not be looking to sell until the bear bar that appears after that double top (at the very end of the chart). If you draw your channel correctly, the bull bar will come to test the channel and fail. You would take an entry when the price goes below the spinning top or after it has cleared the doji.
This is my take on it. Hope I was helpful.
Also a thing to consider is in the first illustration limit order bears are not making much or any money at all selling prior highs so stop order bears are making zero dollars too and the channel is tight so really you need to only be buying at that point, but being cautious because of the major LH on the left. In the second illustration limit order bears make a profit on their first scalp and certainly do if they scale in a point or two higher, I'd say they do on the second push down BE on first and making money on second and on the third they certainly do and you could even argue stop order bears make a scalp on the third below that doji if they were super aggressive as it does not look like a buy to me. The probability of wedge reversal will increase once you start getting a stairs pattern and when stop order bears make money I'd say it's quite a reliable reversal pattern for a two legged correction sideways to down.
Hi Sudeep,
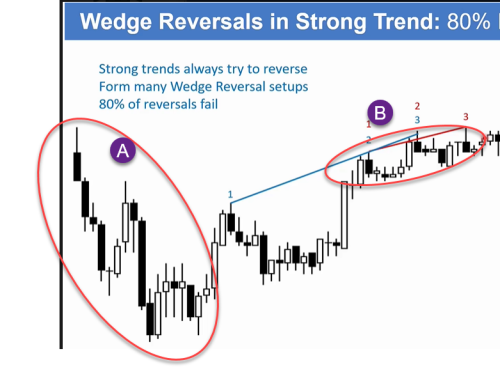
When it comes to trading wedges, it really helps to have big legs up and down that go for at least 5-10 bars (Al had a slide on this). So price action like (A) is much more preferred for taking reversals than (B).
There's also a big problem with the first push up area and the 2nd one too: big cc bull bars: such formations often lead to a 2nd leg up attempt after a PB, just like you said. So if you sell, be prepared for limit bulls to enter at 50% causing tails and bear bars turn into bulls bars in the last couple of seconds.
So let's say you skipped the 1st push up and waited for 2nd. But again, strong cc bulls with bars giving cc higher lows. It's a micro trend, best for such to break, retest prior extreme and so on, even at micro level, just wait it out. Wait for bars to become small again before trying to sell.
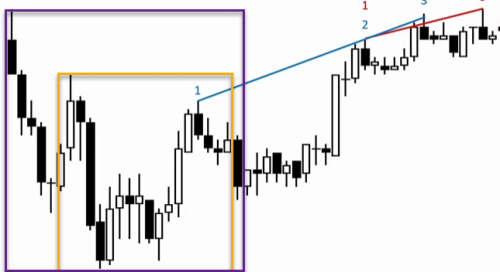
Also regarding selling at top of TR, there's also a question of where should we consider top of TR (yellow or purple). If yellow then fine. But if purple is actually the TR top then selling around 1st push is too much in the middle. Even in TRs it's often better to wait to sell a smaller HL or LH after prior bull leg is too strong.
Hope this helps,
CH
___________________
BPA Telegram Group


