The support forum is built with (1) General and FAQ forums for common trading queries received from aspiring and experienced traders, and (2) forums for course video topics. How to Trade Price Action and How to Trade Forex Price Action videos are consolidated into common forums.
Brooks Trading Course social media communities
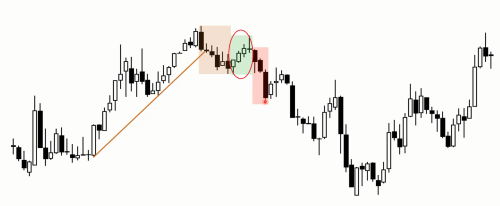
This chart originated from lessons on Major Trend Reversal. However, upon analyzing the chart, I began contemplating a bullish scenario. My reasoning and inquiries are outlined below:
1. The market exhibits a bullish trend in the initial half of the chart, indicating a predisposition towards long positions. Al emphasizes that novices often seek wedge tops in a bull trend. Therefore, I am currently abstaining from actively searching for wedge tops, given the presence of well-formed bullish bars on the left side of the chart, along with noticeable gaps in these bars. The scarcity of bear bars further supports a long-biased perspective. The potential for a bullish trend day is evident, and I am inclined towards a long bias based on this observation.
2. A 50% pullback occurs after the second leg up, which is a notable retracement level often favored by traders for initiating buy positions. Some traders might enter the market at this point (identified by the red circle) with the expectation that the bullish trend will persist, particularly given the bullish bars on the left side of the chart. Their strategy involves anticipating further upward movement and, naturally, they would exit if the chart begins to resemble a Major Trend Reversal (MTR), as illustrated in this particular chart.
Considering the analysis up to the first half of the chart, is my thought process valid?
Moreover, when assessing the first half of the chart, what are some reasons that might dissuade traders from buying the pullback after the second leg up, anticipating a continuation of the bull trend? Despite the 50% pullback, I acknowledge the presence of a formed wedge top and a breach below the bull trend line.
For traders observing the computer screen at the moment when the first and second bull bars inside the red circle appear, while also considering the preceding price action, what should their thought process be according to Al's teachings?
@Mr.Carpet
Hi Sudeep,
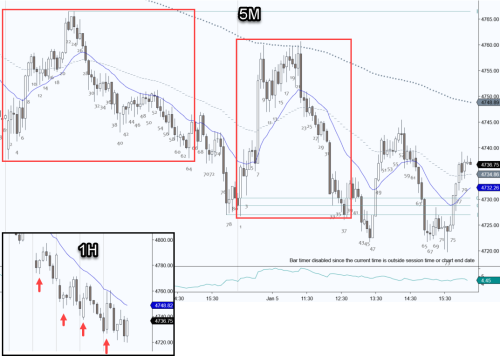
1. Agree, when a day starts strong, it's hard to change bias and consider the opposite direction. But look at what we've had for the last week on S&P. It's interesting to see what's happening on the 1H chart how the bear channel looks - how the day starts, and then how it ends.
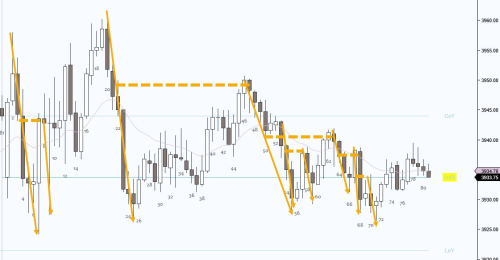
2. While the 50% PB is a popular buying destination, it's often more so in trading ranges and for scalps only. Traders don't want to buy high in TRs so they wait for a PB against the 1st strong leg because most are expecting a 2nd leg attempt. But if the day was a trend with multiple legs and has shown signs of breaking TLs, failed retests of prior extreme and possibly an MTR in progress, I think fewer traders will be inclined to jump in at 50% of the day until seeing where the trading range bottom is going to form. So 50% PB may still be viable, but not immediately (like jumping in with limits the moment it hits 50%).
Here's an interesting day I saved that shows how almost every strong bear leg in this TR was sold at 50% PB.
Hope that helps,
CH
____________________
BPA Telegram Group
But if the day was a trend with multiple legs and has shown signs of breaking TLs, failed retests of prior extreme and possibly an MTR in progress, I think fewer traders will be inclined to jump in at 50% of the day until seeing where the trading range bottom is going to form. So 50% PB may still be viable, but not immediately (like jumping in with limits the moment it hits 50%).
Makes Sense. I need more studying!! Thank you!!


