The support forum is built with (1) General and FAQ forums for common trading queries received from aspiring and experienced traders, and (2) forums for course video topics. How to Trade Price Action and How to Trade Forex Price Action videos are consolidated into common forums.
Brooks Trading Course social media communities
I am bit confused on what Al refers to when he says neckline on the double top in 20A at 6:17 on the video. Can you some body help? The screenshots seem to be blacking out.
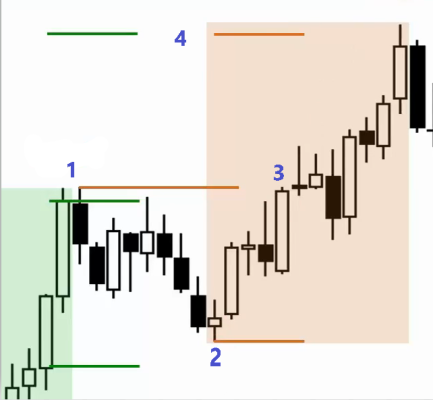
A traditional double top has an "M" shape where the neckline is the middle point of the "M". The minimum expected move of a successful double top is a measured move down from the top of the "M" to the middle point (the neckline). In video 20A Al gives an example of a failed double top:
In this example if the market turned down after bar 3 the chart would have created a successful double top shape with point 2 being the neckline. The expected move would be a measured move down from point 1 or 3 to point 2.
This is an example of a failed double top because instead of the market turning down at point 3 it broke out to the upside. In this case the expected move is a measured move up from point 2 (the neckline of what would have been a double top) to point 1. The measured move target is indicated by the line at point 4.
Thanks for clarifying with a picture and numbering on it. It really helped

