The support forum is built with (1) General and FAQ forums for common trading queries received from aspiring and experienced traders, and (2) forums for course video topics. How to Trade Price Action and How to Trade Forex Price Action videos are consolidated into common forums.
Brooks Trading Course social media communities
Hi all.
So far I am enjoying this course.
I think it is easy to look at a chart after the entire session and saying where you wanted to be short etc.
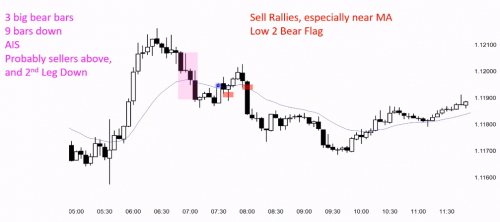
And if you look at the chart, we have a good bull BO from around 5:30-6:30. To me, the 9 bars down is significant but we can not forget the fact that we are still above the low of the BO from 5.30-6.30.
Why should we not be Always In Long at that exact moment when we have the 9 bars down?
To me, it would be a failure to say that we are now Always In Short just because of a PB with 9 bars down - and yes I do know that after 8:00 it would be a successful trade but we do not know what will happen to the market at 8:00 when the time is 7:00.
Kind regards,
Benjamim
The Always-in direction is intended to tell you the market direction in the next few bars, so you can take trades. Yes, as long as the MKT stays above the BO low the bull trend premise was still in play but the 4 bars in purple made more likely a second leg down in what looked like a PB, so AIS. If you, rather, saw the MKT there AIL, you would be looking to buy and it was too early. Next leg was also strong so it was needed a third leg down before the MKT turned up but when it did the PB had been so deep that it was more likely to be in a TR than in a bull trend.
Hi Benjamin, I'm also enjoying learning what's on Brooks' mind when he sees the chart and I'm trying my best to adhere to his foundation with some of my own observations/critical thinkings. Grab a coffee and bear with me, it's gonna be long.
First of all, I always read a chart from left to right because that's what we do in real time. The chart didn't show candles from the far left, but I expect the market was in a strong bear trend or at least in a bear trading range price action earlier since the first 9 bars are well below the 20 EMA. The strong bear trend premise might be wrong judging from the fact that there was no strong selling pressure once the market hit the EMA, although we might argue that the unusually large doji bear bar with long tails on both sides was a failed bear breakout that was reversed by huge buying pressure. Big up, big down, big confusion is the hall mark of a trading range price action. To me, that bar is important: it opened near the low of the previous bar and quickly went down in price as the bears were hoping for another bear trend bar closing on its low. However, the market decided to go up well above the high of many bars earlier but closed near its open; it's still a bull close after all. The next bar was a stronger bull trend bar closing on its high and above the EMA, followed by another EMA gap bar. These bars indicate the market has turned into an Always-in-long, or trying to test the previous major pivots (not shown here). So, we could tell where the market is going from there, not to mention when we set a limit order above the small bear doji's high, our risk is relatively low. Also notice there wasn't really a visible second entry after the market broke above the EMA. These price actions tell us the consecutive bull trend bars that look climatic is a bull leg in a larger trading range, so expect a bear leg or many bear legs through the low of the entire bull leg. The bull leg was followed by a strong PB to 50% of the leg, it's so strong that we should expect another leg down (leg 1 = leg 2). Price target should be the start of the bull leg.
I don't remember where I read this, but here is a quote worth mentioning: "give 10 traders the same chart, they will draw 10 different trend lines using 20 combinations of analyses, tools in their own styles." I'd recommend taking the charts from the videos as a reference to help you grab the concept, or you can analyze on your own while watching the videos. Reading the EURUSD 5-min chart live is another way to go.

