The support forum is built with (1) General and FAQ forums for common trading queries received from aspiring and experienced traders, and (2) forums for course video topics. How to Trade Price Action and How to Trade Forex Price Action videos are consolidated into common forums.
Brooks Trading Course social media communities
Hello,
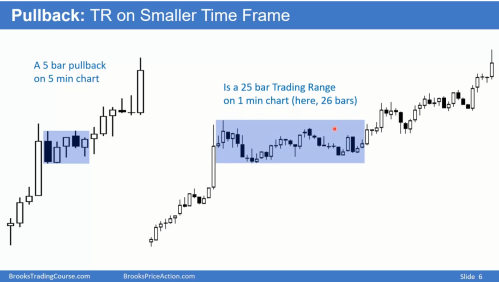
I'm currently going through the course for the second time. Most concepts are already much clearer to me than they were during my first go, but I've had some problems wrapping my head around the concept of pullbacks being trading ranges on a smaller timeframe, as shown on the following slide:
In this slide, Al compares two charts of the exact same PA in two different timeframes. Since the 5 min chart on the left only has a short pullback in a trend, he concludes that trend continuation can be expected. In the 1 min chart, the same pullback appears as a 26 bar trading range, so Al concludes the probability of trend continuation is now only 50%.
How is this possible? Isn't this a contradiction? Both charts show the exact same PA. Why does changing the timeframe change the probability of trend continuation? My only guess is that it could have something to do with the size of swings and scalps and the stop placement depending on the timeframe, thus also affecting probabilites. But I'd be grateful if someone more experienced could clear this up.
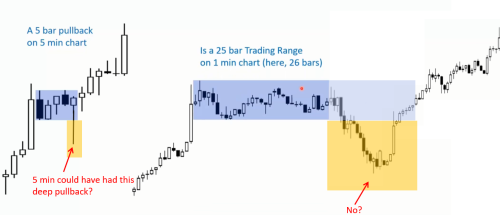
It can be a bit confusing. He then gives a further explanation in slide 17. I think He's trying to say that even if you have a TR on a smaller timeframe the overall picture is still the one that matters because that TR is holding above a major HL , and a possible bear BO can represent just a more complex pullback on the higher timeframe(so expect it to fail), as long as it holds above the major HL.
So if you are placing your stop loss below that smaller time frame TR chances are it's below a minor HL hence more risk it'll be hit.


