The support forum is built with (1) General and FAQ forums for common trading queries received from aspiring and experienced traders, and (2) forums for course video topics. How to Trade Price Action and How to Trade Forex Price Action videos are consolidated into common forums.
Brooks Trading Course social media communities
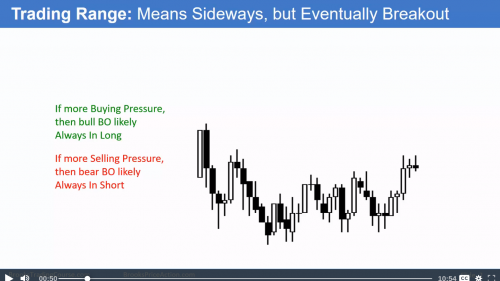
Um, do you have a question here? I am a beginner but to my understanding from the videos, there are other factors to watch as well. It would be too easy if just looking at one thing worked and we didn't have to look for other things. As I understood so far, context holds much more relevance.
I'm just looking for a constructive fight 🙂
What context would you be looking for *inside* of a TR that gives you a clue into which direction it will break out?
I really can't think of anything. Al says 50/50 himself as soon as it grows to "20 bars".
I think both things are right (the screenshot and what you are saying). It's like Al says in the course TRs have both a good buy setup and a good sell setup.. Why am saying Al is right because a TR eventually breaks out, and if you are on the lookout for that possibility then you might have an edge by entering early (in the possible BO direction) or not scalping out at the extreme of the TR and waiting to see if it breaks out..
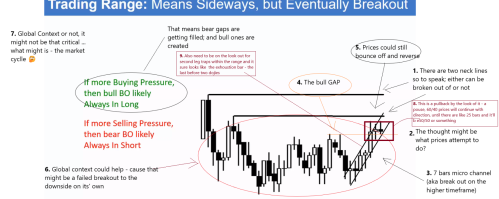
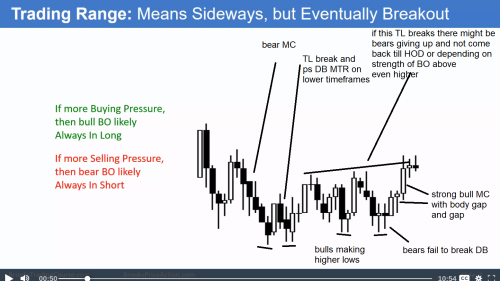
Like Abir above said, there are other things to look out for.. Like the examples Al gives in that video, if you start seeing things happening which were not happening earlier in the TR, signs of BP or SP building, which were not there earlier in the TR. Then its a clue that MAYBE things are beginning to change.
The context that you'd look for is what Al says in that video... More Consecutive bull bars than there were in earlier legs, lesser and lesser bear bars than earlier legs. Bull bars getting bigger. The bear legs not going as high as they were going in the earlier part of the TR. (Opp for SP)
So as a trader you have to be on the prowl and not get lethargic and take TR for granted... So if a BO happens you would have a guesstimate that are chances of it succeeding high this time..
I am nowhere near to being qualified for a 'constructive fight'.
If I may add to what Shubh said, I sometimes get the feeling from Al's trading course or his blogs - higher time-frames might help you decide on which direction the breakout might be likely. For example, a trading range on one time frame might be part of a broad channel or even a tight channel on a higher time-frame.
Like I said, I am a beginner. So, you won't find proper insights from me. Do correct me or point out my mistakes, if you find any somewhere. It would help me.
You're correct, I'd just like to add some caution here, be careful at how high a TF you're looking at, and always confirm what HTF is telling you with PA on LTF. Because on LTF your stop might get hit and according to HTF PA your original PA direction based on which you took that trade, might still hold true..
Before studying the BP SP material from Al, I’ve been trading TR for lots of times and notice in my gut feeling direction the price would PROBABLY breakout. But it is just a feeling, not logical.
Explanation from Al confirms and logically explained the gut feeling I have. It is the numbers of bull bars (for bull BO), the size of bull bars, higher lows & highs (more importantly the higher lows) and consecutives bulls bars. All that combination. Same for bears just the opposite. I don’t know what percentage the probability is, but I have pretty good confidence to trade the TR BO base on BP & SP. When it failed (less frequent), the stop loss takes care of it.


