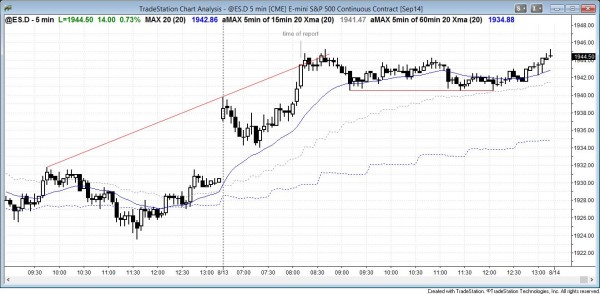
I posted this chart after the close. The bulls had a breakout above a two week double top, which is the neckline of a 60 minute head and shoulders bottom. However, the Emini entered a tight trading range for the rest of the day, with a little trend resumption up into the close. The close of the day was slightly above the daily moving average, which is a sign of strength for the bulls. They next want to close the gap above the July 31 bear trend bar and then move to a new all-time high. Even if they succeed, I think that the S&P500 will probably still be in a trading range on the daily chart. The bears want this rally on the daily chart to fail and for the stock market to reverse down for a second bear leg.
Time of update 8:12 a.m. PST.
The Emini broke out above a two week long head and shoulders bottom. It gapped up to near the top of the two week trading range, but sold off to the moving average where it formed a wedge bull flag and a bull opening reversal. It then entered a tight trading range, which means that it was in breakout mode at the top of a two week trading range. The bears wanted a large triangle and a failed bull breakout, and the bulls wanted a successful breakout and a measured move up.
The bull breakout at 8 am was strong enough so that there will probably be a second leg up. The bears want a failure, but will probably need a second signal before the market can turn down. The day will probably be a bull trend day or a trading range day. If the Emini stalls, it might reverse back down to the open of the day later in the day and create another doji bar on the daily chart.
Weekly, daily, and 60 minute higher time frame charts
The S&P500 Emini is continuing its second leg up on the 5 minute and 60 minute charts from the 60 minute wedge bottom and the weekly moving average. The bull day traders are hoping that the reversal up will lead to a new high and a resumption of the bull trend.
The Emini had a doji bar on the daily chart both Monday and Tuesday when it tried to breakout above the daily moving average. It is trying again today. But, where are the big, consecutive bull trend bars? There is no strong buying pressure, and that makes this 3 day rally more likely part of a trading range than a resumption of a bull trend. If so, it should soon get another leg down.
Unless the Emini begins to create stronger bull bars, the bulls will begin to wonder if this leg up will fail. This will make many of them exit, and their selling out of their longs can help create a second leg down. The bears will also see this lack of buying pressure and it will encourage them to short.
The stock market is trying to breakout above the top of the two week trading range and then get a measured move up. The Emini especially wants to get above the high of the bear breakout of July 31 and close the gap above that bar to erase the strength of the bears. Even if it does, and even if the S&P500 goes to a new all-time high, it still might form a major trend reversal and get a second leg down. I believe that the second leg down on the daily chart is still more likely than not, but if the Emini reverses up strongly or relentlessly, the bull trend will resume.
The buy signal bar on the weekly chart was a small doji, which is a trading range bar. Since it therefore did not have a big bull body, it did not show much buying pressure and it probably will not be strong enough to reverse the bear breakout bar of the prior week. This means that there probably will be more sellers than buyers somewhere above last week’s high. The result will then probably be either a tight trading range or a second leg down.
The bears hope that this second leg down will result in a bear trend. The monthly chart is in such a tight bull channel that the best the bears are likely to get is a few bars down on the monthly chart, which means a 100+ point trading range on the daily chart.
See the weekly update for a discussion of the weekly chart.
Traders can see the end of the day bar-by-bar price action report by signing up for free at BrooksPriceAction.com. I talk about the detailed Emini price action real-time throughout the day in the BrooksPriceAction.com trading room, and a 2 day free trial is available.
When I mention time, it is USA Pacific Standard Time (the Emini day session opens at 6:30 am PST, and closes at 1:15 pm PST). You can read background information on the intraday market reports on the Intraday Market Update page.

