Trump rally is exhaustive buy climax at measured move targets
Updated 6:45 a.m.
While the Emini gapped up to a new all-time high, it sold off on the 1st 2 bars. Since this is a 3rd push up on the 60 minute chart, it is a wedge top. Yet, there is still room to the top of the wedge channel, Furthermore, neither of the 1st 2 bars closed on its low. The conflicting signals increase the odds of a trading range open for the 1st hour or two. In addition, it increases the chances that today will again have a lot of trading range price action.
While the Emini is Always In Short, the bears need big consecutive bear trend bars is today will be a strong bear trend day. Alternatively, they could take control by forming a series of smaller bear bars that close on their lows. Without that, the odds are that the selloff will be a bear leg in a trading range. Since the Emini is far above the daily moving average and has 3 bear bars, the odds are against a big bull trend day.
Pre-Open Market Analysis
Yesterday was another trading range day. While Monday gapped up, the gap is late in the bull trend and part of a buy climax. It therefore will probably be an exhaustion gap. Hence, the Emini will probably close the gap within the next few days. If today gaps down, there would be a 2 day island top.
While the odds favor a test of the December close within the next 2 months, most tops fail. Therefore selling every top is a losing strategy. It is better to wait for a strong top or for a strong bear breakout. The Emini has neither yet. Hence, the odds still favor sideways to possibly up a little more.
Last week had an ii late in a bull trend. Therefore, the Emini will probably enter a trading range within a couple of days. Furthermore, the Emini is in a zone of measured move targets on the weekly chart. In addition, it is in a buy climax. Therefore, the odds of much higher prices near-term are 40% or less.
Overnight Emini Globex trading
The Emini is up 3 points in the Globex session. Because the daily and 60 minute charts have been sideways for 2 days in a bull trend, the odds favor at least one more new high. If today opens here, there will be another gap up. Since the rally is a buy climax, the odds are that it will not last more than a day or two.
Because it would be a 3rd push up on the 60 minute chart, a reversal down would create a wedge top. A pullback from there could create a trading range going into the March 16 FOMC meeting. There is still a 60% chance of a 5% pullback to the 2016 close within the next couple of months. A catalyst like a rate hike will probably start the correction.
EURUSD Forex Market Trading Strategies
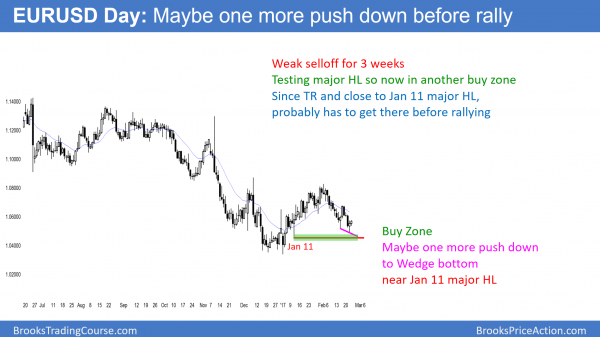
While the daily chart of the EURUSD has a lower low double bottom with last week’s low, it has been in a trading range for 50 bars. Since reversals usually come from at or below support in trading ranges, the odds favor a little more down before a 100 – 200 pip rally.
The daily chart has been in a bear channel for 4 weeks. Since last week formed a bull reversal bar and a lower low double bottom, a rally to last week’s high might have begun. Yet, when a market is in a trading range and just above support, the market usually has to reach or fall below support before it can reverse up. Therefore, traders expect one more push down to test the January 11 low. But, if the daily chart forms several consecutive strong bull trend bars from here, they will conclude that the bottom is in.
The bears want a strong breakout below that major higher low. In addition, they want a break below this year’s low and then a test of par. Because this selloff has been weak, it is more likely a bear leg in a trading range. Hence, it will probably lead to a bull leg and not a bear trend.
Overnight EURUSD Forex trading
While the 5 minute chart rallied 40 pips overnight, it is still in its 3 day trading range. The reversal up has not been strong. Furthermore, it is at the top of a 3 day wedge bear flag. The bulls want a strong breakout above last week’s high. Hence, they are hoping that the 4 week selloff has ended and that a higher low major trend reversal has begun. Because of the magnetic pull of that January 11 low, there is more than a 50% chance that the daily chart will have one more leg down to that low.
The bulls need a strong reversal up above last week’s high before traders will believe that the 200 pip rally to the February 2 top of the 2 month trading range has begun. Hence, the odds still favor one more push down.
Summary of today’s S&P Emini futures price action and what to expect tomorrow
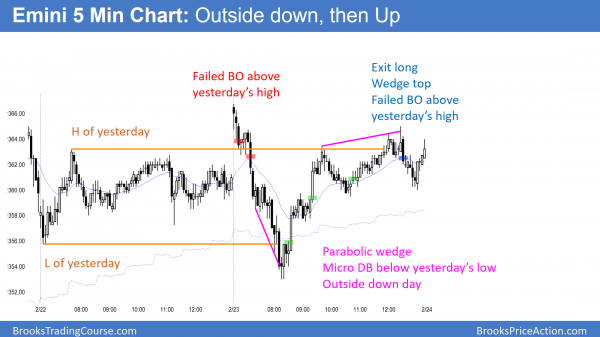
The Emini formed and outside day and reversed up from below yesterday’s low with a parabolic wedge. It then rallied back above yesterday’s high, but stalled at a wedge top.
Today was interesting because it was an outside down day that reversed back above yesterday’s high. The Emini is far above the weekly moving average. Therefore, it probably will not get much higher over the next 2 weeks. Yet, it does not have a credible top. The odds are that it will be mostly sideways into the March FOMC report in 3 weeks.
See the weekly update for a discussion of the price action on the weekly candlestick chart and for what to expect going into next week.
Traders can see the end of the day bar-by-bar price action report by signing up for free at BrooksPriceAction.com. I talk about the detailed S&P Emini futures price action real-time throughout the day in the BrooksPriceAction.com trading room. We offer a 2 day free trial.
When I mention time, it is USA Pacific Standard Time (the Emini day session opens at 6:30 am PST, and closes at 1:15 pm PST). You can read background information on the intraday market reports on the Intraday Market Update page.


