Emini gapped up but need follow through buying
Updated 6:45 a.m.
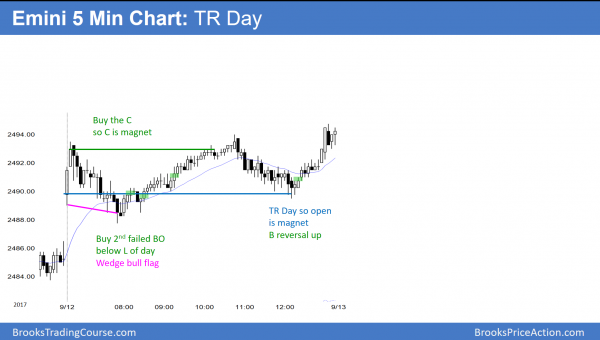
The Emini gapped up and began with consecutive bull bars, like yesterday. Yet, the gap and bars were smaller today. In addition, yesterday’s 40 bar tight trading range is a magnet. Therefore, the bears will look to sell a failed breakout above yesterday’s high. Because of the 2 initial bull bars, many bears will wait for a 2nd failed breakout or a series of bear bars before selling.
The reversal on the 3rd bar and yesterday’s tight trading range reduce the odds of a strong bull trend day. Because a strong bear day is unlikely and the initial rally is not strong, the odds favor a trading range open. In addition, there is an increased chance of a lot of trading range trading again today.
Pre-Open market analysis
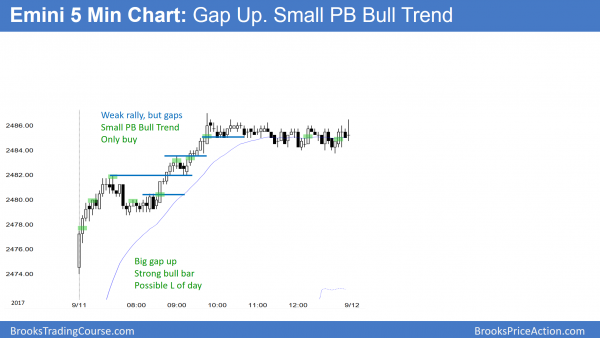
Yesterday gapped up and it rallied in a Small Pullback Bull trend day to a new all-time high. Since that is a type of buy climax, there is a 75% chance of at least 2 hours of sideways to down trading beginning by the end of the 2nd hour. While there is a 50% chance of follow-through buying in the 1st 2 hours, there is only a 25% chance of another strong bull trend day.
The bears want a reversal down from the new high. If they get it, there will be an expanding triangle top, which is always a higher high major trend reversal. However, they will probably need at least a micro double top after yesterday’s strong rally. Therefore the odds are against a strong bear day today.
Financial markets often go sideways into catalysts, like next week’s FOMC announcement. In addition, the bull breakouts in the 7 month bull channel have been brief. They led to trading ranges within a couple of bars. While today might be another bull trend day, the odds are that the Emini will begin to have trading range days starting either today or tomorrow.
Overnight Emini Globex trading
The Emini is up 4 points in the Globex market, and it therefore might gap up again today. The next magnet is the 2500 Big Round Number. Since yesterday was a buy climax, the odds are that today will be more two-sided. However, since yesterday was a strong bull trend day, there is an increased chance of another bull trend day today. In addition, there is a reduced chance of a bear trend day.
Yesterday’s setups
Here are several reasonable stop entry setups from yesterday. I sometimes also show limit order entries and entries on the close of bars.
EURUSD Forex market trading strategies
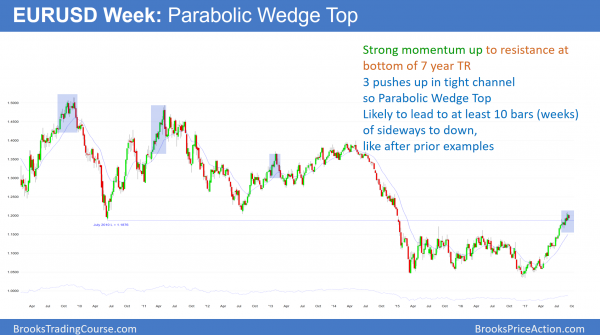
The weekly EURUSD Forex chart has a bear bar so far this week after last week’s strong bull bar. This is the 3rd consecutive time that a bear bar followed a strong bull bar. Hence, this is a parabolic wedge top. In addition, it is after resistance. Furthermore, the rally has been long and therefore climactic. When this has happened in the past, it marked exhaustion and the end of the rally for at least 10 weeks.
The weekly EURUSD Forex chart has a parabolic wedge buy climax at resistance and after a buy climax. There is a 60% chance that this will lead to ten or more bars of sideways to down trading, as it has in the past. Yet, the rally since April has been in a tight bull channel. Therefore the 1st reversal down will probably be minor. Consequently, the best the bears will probably get is a pullback. Since support is at the top of the 2 year trading range at around 1.1600, the trading range could be 400 pips tall.
There is always a bull case, and there is a 40% chance that the parabolic wedge will fail. For example, the bulls tried to create a parabolic wedge bottom in December 2014. Yet, the bears got a bear breakout below the wedge bottom and then a 1700 pip selloff. However, this rally is the 1st attempt to break above the bottom of a 7 year trading range, which is major resistance. Since 1st breakout attempts usually lead to pullbacks instead of successful breakouts, the odds are that the weekly chart will pull back soon.
Overnight EURUSD Forex trading
While the 5 minute chart sold off 50 pips over the past 6 hours, the selloff lacked consecutive big bear bars. In addition, it is near the support of Thursday’s buy climax low and the daily moving average. Furthermore, yesterday’s tight trading range is a magnet. Finally, there is an FOMC announcement next week, which is a catalyst. Markets usually enter a trading range before major announcements. Consequently, day traders expect more trading range trading again today, which means they plan to scalp.
Summary of today’s S&P Emini futures price action and what to expect tomorrow
While the Emini gapped up, it formed a trading range day.
The Emini had weak follow-through buying after yesterday’s breakout to a new high. There is no sign of a top, but if the Emini forms a bear reversal bar on the daily chart in the next few days, that would be a sell signal. The rally from the August low is a wedge. There would therefore be a wedge higher high major trend reversal. In addition, there would be an expanding triangle top. At the moment, more sideways trading into next week’s FOMC meeting is most likely.
See the weekly update for a discussion of the price action on the weekly candlestick chart and for what to expect going into next week.
Traders can see the end of the day bar-by-bar price action report by signing up for free at BrooksPriceAction.com. I talk about the detailed S&P Emini futures price action real-time throughout the day in the BrooksPriceAction.com trading room. We offer a 2 day free trial.
When I mention time, it is USA Pacific Standard Time (the Emini day session opens at 6:30 am PST, and closes at 1:15 pm PST). You can read background information on the intraday market reports on the Intraday Market Update page.


