Stock market buy climax pullback
Updated 6:59 a.m.
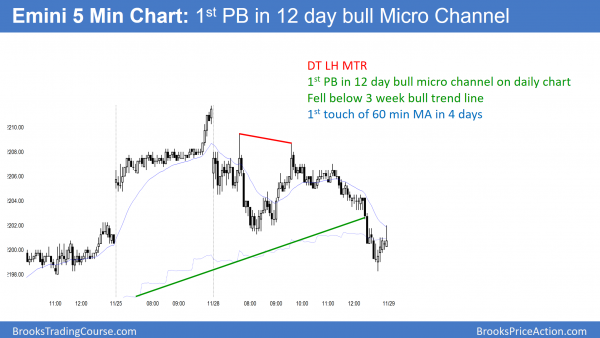
The Emini reversed up from below Friday’s low on the open. Hence, this is the 1st pullback in a 12 day bull micro channel. The bulls want an outside up day and therefore another new all-time high. Yet the rally was weak, as was the initial selloff.
While the pullback could extend down to the 60 minute moving average, the bottom of the 3 week channel, Thursday’s high to close the gap, and the 2200 Big Round Number, the odds are that it will last only 1 – 3 day. Therefore, traders expect a rally and a test of Friday’s high before the bears will be able to create a bigger pullback.
Whenever there are clear bull and bear targets like this, traders are confused. As a result, the Emini will likely not have a strong trend day today. Confusion increases the chances of a trading range around the support and resistance. Furthermore, the odds are that the Emini will reach both the support and resistance levels this week. Traders are deciding which it will test 1st.
This early trading range price action combined with the likely trading range over the next few days makes a trading range day likely. While a strong trend can come at any time, it is more likely that any trend today will be limited to 2 – 3 hours. It would therefore more likely be a leg in a mostly trading range day.
Pre-Open Market Analysis
Because the Emini has had 13 bars in its bull micro channel, the odds are that there will be a pullback this week. A pullback simple means that a bar will trade below the low of the prior bar. Bulls typically buy the 1st bear breakout below a bull micro channel. Therefore, the odds are that the pullback will last only 1 – 3 days. The rally that follows usually only lasts 3 – 5 days.
At that point bulls usually take profits and bears begin to sell. As a result, the Emini usually trades down for about 10 bars from that micro double top. Hence, the odds favor higher prices this week. Yet, they also favor a couple of weeks of sideways to down trading after the new high.
Overnight Emini Globex trading
The Globex Emini last night traded below Friday’s low. It therefore was the 1st pullback in a 13 bar bull micro channel. As I wrote over the weekend, because this is extreme buying, the odds are the day session will also have a pullback this week. It is also a sign of strong bulls. Therefore, they usually buy the 1st pullback. Yet, because of the unsustainable strength, the tight bull channel then typically evolves into a trading range for about 10 bars (days). Hence, that is what is likely here.
While the rally can continue much higher before there is a pullback into a trading range, a trading range is more likely to begin this week. A bear trend can begin at any time, but that is a low probability bet without at least a micro double top. Even then, when a bull channel is this tight, the odds of a strong reversal down without at least a small trading range are under 30%.
EURUSD Forex Market Trading Strategies
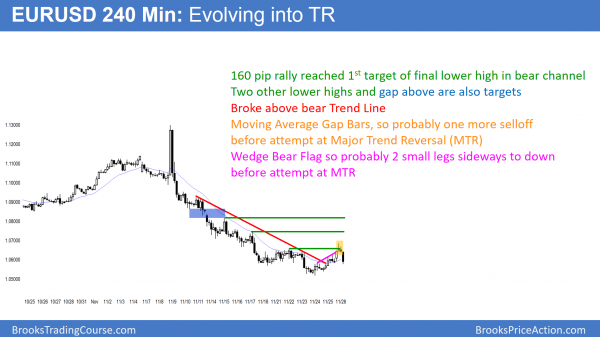
After a 160 pip rally to above a lower high and the bear trend line, there are some gap bars on this 240 minute chart. This 3 day wedge bear flag will probably have a couple small legs down. Then, the bulls will try to create a major trend reversal. There are targets above. Hence, a big trading range is likely.
I wrote last week that the EURUSD daily chart would probably fall a little below the December 2015 low and then rally for 200 pips. It fell about 20 pips below that low, and rallied 160 pips so far. While the bears are eager to resume the bear trend, the selling has been climactic. Most bears will not be eager to sell again for about 10 bars, or 2 weeks. Therefore, the odds still favor a 2 legged rally lasting about a couple of weeks.
Targets for the bear rally
Since bears put stops above higher lows, these are targets for the rally. The obvious one is the November 22 high, which is the top of a potential Final Bear Flag on the 240 minute chart. That high is about 150 pips above this week’s low, and the bulls reached it last night. While a rally there might be the top of the bear flag, there are many lows around 1.0800 on the daily chart. That resistance is a magnet. Since it was tested so many times this year from above, it will probably now get tested from below. Therefore, the bear rally will probably go up at least 200 pips from this week’s low.
Overnight EURUSD Forex trading
The EURUSD Forex market sold off for the past 5 hours. Yet, it is only a 50% pullback from last week’s rally. Because the selloff was strong, the odds favor at least a small 2nd leg down. Since there are gap bars on the 240 minute chart, the odds are that the selloff will lead to another rally around the December 2015 low. There is a 60% chance of at least another week of trading range price action. As a result, traders will correctly see buy and sell setups.
Probable Major Trend Reversal buy setup this week
The 3 day rally reversed down strongly over from a 3 day wedge bear flag over the past 5 hours. Since this was a wedge rally, traders expect a couple of legs down. Yet, the 240 minute chart had Gap Bars. As a result, traders see that the bulls were strong enough to put bars completely above the moving average.
Furthermore, the rally broke above the bear channel. These are common ingredients in a major trend reversal. Therefore, the likely 2 legged selloff will probably again find buyers around the December 2015 low. If so, that could create a major trend reversal buy setup. Hence, there would be a 40% chance of a strong swing up, possibly to October 25 neck line of the 10 month head and shoulders top.
Probably 2 more weeks of trading range
Even when there is a major reversal, the chart usually evolves into a big trading range. Most attempts at a major trend reversal result in a small trading range. The bears are hoping that the 3 day rally is simply a pullback from the breakout below the December 15 low. While they have a 40% chance of a strong selloff below that low, there are more likely buyers below. There is therefore a 60% chance of either a trading range for a couple of weeks. There is a 40% chance that there will be a major trend reversal up to the October 25 low.
Summary of today’s S&P Emini futures price action and what to expect tomorrow
Today was the 1st pullback in 12 days on the daily chart. The chart above is a 5 minute chart. The Emini fell to the 3 week bull trend line and the 60 minute moving average.
Today was the 1st pullback in a 12 day bull micro channel. The Emini also tested the 60 minute moving average. The pullback will probably last 1 – 3 days. The odds then favor one more new high and then a pullback lasting about 10 days.
See the weekly update for a discussion of the price action on the weekly candlestick chart and for what to expect going into next week.
Traders can see the end of the day bar-by-bar price action report by signing up for free at BrooksPriceAction.com. I talk about the detailed S&P Emini futures price action real-time throughout the day in the BrooksPriceAction.com trading room. We offer a 2 day free trial.
When I mention time, it is USA Pacific Standard Time (the Emini day session opens at 6:30 am PST, and closes at 1:15 pm PST). You can read background information on the intraday market reports on the Intraday Market Update page.


