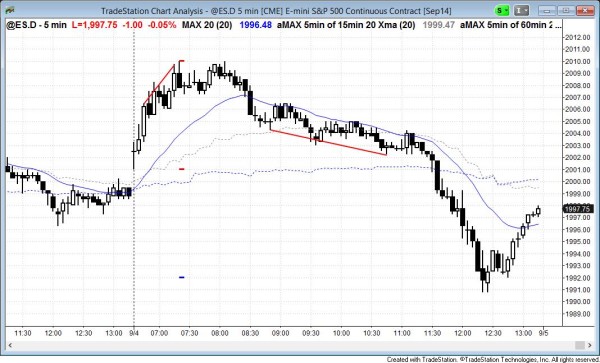
The S&P500 Emini rallied strongly on the open to a new high, but like all of the new highs over the past two weeks, there were enough sellers to turn the stock market back down. The rally was just a buy vacuum test of resistance (the new high and the top of the channel). The day became an outside day.
End of day comments about today’s Emini price action and day trading
The S&P500 Emini rallied strongly on the open to another new high in the 7 day broad bull channel. However, like all prior new highs in the channel, the rally found day traders who wanted to sell above the most recent new high in the bull channel. The Emini then sold off to below yesterday’s low and formed an outside candle on the daily chart. This is a bearish event, given how overbought the stock market is on all time frames. However, the Emini closed back above yesterday’s low and turned the day into a doji candle. The bear body is good for the bears, but they need a strong bear breakout before traders believe that the bull trend is beginning to correct. Otherwise, the tight trading range of the past eight days will continue.
The Emini has also rallied 4 days above the bear breakout below the tight July bull channel. When a tight bull channel occurs late in a bull trend, it is often a sign of exhaustion and can lead to a deep pullback. After the first breakout below the tight channel or microchannel, the stock market often rallies for a few days, like it has, and then corrects down. Traders will be looking for a sell setup over the next few days.
The Emini is having a difficult time holding above 2,000 and above prior highs. This is a sign that the bulls are less interested in buying up here. The Emini might have to trade down to find a price where the bulls will be again willing to buy.
S&P500 Emini intraday market update for price action day traders
Time of update 7:54 a.m. PST.
The Emini had a strong bull trend on the open, but the rally might be simply a buy vacuum test of yesterday’s high, leading to a double top. However, it is still in a bull trend, although it has been in a trading range for an hour. It might continue in a trading range for a long time. If so, the bulls will look for a bull breakout and trend resumption up. The bears will try to create a major trend reversal and then get a bear breakout and measured move down.
The Emini has been in a trading range and a broad bull channel for seven days. Every new high over the past 7 days has found sellers, and the Emini then fell back into the bull channel or trading range every time.
The Emini rallied 7 points above the open, and that reduces the chances of a bear trend day, and it increases the chances of either a bull trend day or a trading range day. Despite the strong rally on the top open, the stock market is at the top of the broad bull channel and trading range that has lasted 7 days. This increases the chances that today will probably stay mostly sideways for day traders, especially since tomorrow is the unemployment report.
Whenever there is a strong rally to resistance, traders have to be aware of the possibility of an endless pullback where there is a tight bear channel that just keeps growing. If that happens, there is usually a bear breakout after about 20 – 30 bars because the bulls usually finally give up. That bear breakout usually leads to about a measured move down. Even if the stock market falls below the open, the odds are that the day would end up as a doji day instead of a bear trend day because the early rally went very far above the open.
S&P500 Emini monthly and weekly candle charts
The Emini yesterday formed a bear trend candle. Since the Emini is trying to break out above the July high and above 2,000, a bear candle is a sell signal bar. However, the bar is within a seven bar tight trading range, which is a low probability environment for entering positions with stops. Most breakout attempts up and down fail and the tight trading range tends to continue. The context is good for the bears, as I have discussed in the weekly update, but until there is a strong bear breakout, the probability of a profitable short using a stop entry is low.
See the weekly update for a discussion of the weekly chart.
Traders can see the end of the day bar-by-bar price action report by signing up for free at BrooksPriceAction.com. I talk about the detailed Emini price action real-time throughout the day in the BrooksPriceAction.com trading room, and a 2 day free trial is available.
When I mention time, it is USA Pacific Standard Time (the Emini day session opens at 6:30 am PST, and closes at 1:15 pm PST). You can read background information on the intraday market reports on the Intraday Market Update page.

