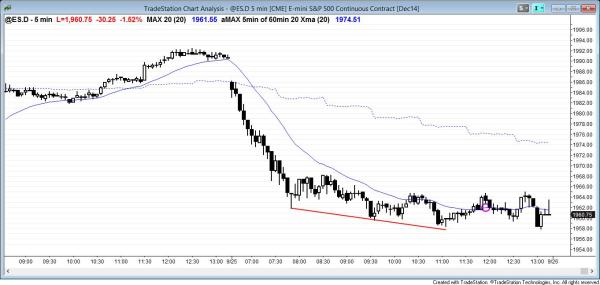
Today was an exceptionally strong bear trend day. The big breakout was followed by a bear channel.
End of day comments about today’s Emini price action and day trading
Today triggered a second entry short on the weekly chart for a failed breakout above the July high. It is also a low 4 short in a bull channel. The odds are that the Emini will work down to around 1900. It might bounce there and then form a larger head and shoulders top. This might be followed by a move down to the monthly moving average, which would relieve the extremely overbought price action on the monthly chart.
S&P500 Emini intraday market update for price action day traders
Time of update 7:27 a.m. PST.
The Emini had a strong bear trend on the open, and it fell below yesterday’s low and the bottom of the month long trading range. The breakout below yesterday’s low was a big bear trend bar and therefore a sell climax. The initial bear trend fell for almost 20 points. This makes a bull trend day extremely unlikely. Today will probably be a bear trend day, but because the selloff was so strong, the Emini might enter a trading range or have a bull channel lasting 2 – 3 hours.
S&P500 Emini 60 minute, daily, weekly, and monthly candle charts
I wrote this paragraph before the open. Yesterday was a strong bull trend day. The Emini reversed up from the bottom of a month long trading range. It probably will test the July high. The bears will want a lower high major trend reversal (a head and shoulders top), and the bulls want the Emini to break out to an all-time high. Trading range breakouts usually fail, as we saw yesterday with the failed bear breakout attempt. The odds are that the rally will fail. However, because the Emini is so overbought on the monthly chart, this potential head and shoulders top has a better chance than most of succeeding. If it does break out below yesterday’s low, the first target would be a measured move down. The next is the 1900 area, which is the August low.
See the weekly update for a discussion of the weekly chart.
Traders can see the end of the day bar-by-bar price action report by signing up for free at BrooksPriceAction.com. I talk about the detailed Emini price action real-time throughout the day in the BrooksPriceAction.com trading room, and a 2 day free trial is available.
When I mention time, it is USA Pacific Standard Time (the Emini day session opens at 6:30 am PST, and closes at 1:15 pm PST). You can read background information on the intraday market reports on the Intraday Market Update page.

