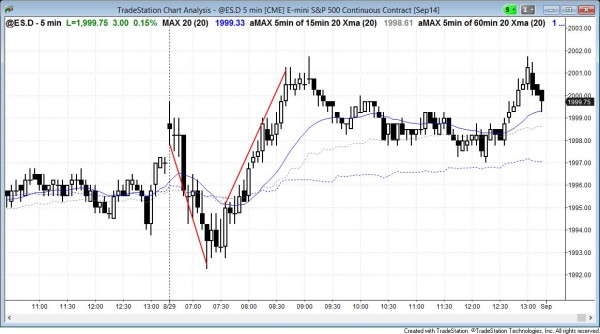
The S&P500 Emini had a strong bull trend reversal. After a long bear channel, the Emini retested its high going into the close.
End of day comments about today’s Emini price action and day trading
The S&P500 Emini reversed up in a parabolic wedge from last week’s high. It then formed a parabolic wedge top just above 2000 and entered an endless bear channel. When that is the case, day trading bulls usually should wait for a strong breakout above the channel before buying. Some bulls simply use a wide stop. Others wait for a strong setup, like the high 4 at 12:30. The rally to 9:05 was so strong that the odds favored a test after the pullback. The test came in the final minutes.
The day trading bears kept betting that the bear channel would last forever, and they kept shorting exactly where the eager bulls were buying. The bears were betting on inertia…that the Emini would continue to do what it had been doing. They were betting that every buy signal would fail, knowing that eventually they would be wrong, or that there would be a strong bear breakout and a measured move down. They correctly believed that they would have made so much profit by the time a bull reversal formed that the loss on that day trade would not be enough to erase their gains.
S&P500 Emini intraday market update for price action day traders
Time of update 7:46 a.m. PST.
Five of the first 6 bars on the S&P500 Emini chart today were dojis, which is trading range price action. The Emini sold off for the first hour, but there were no consecutive big bear bars closing on their lows. This is more common within trading ranges than in bear trends. Yesterday had a four hour tight trading range, which is a magnet. The initial sell of is probably enough to prevent today from becoming a bull trend day. However, it was weak and today more likely will be a trading range day. Traders will buy low, sell high, scale into both, and scalp. Until one side clearly takes control, the day will probably have trading range price action all day. For the day to become a trend day up or down, the Emini needs to create a strong breakout. This can be one or two big trend bars or 4 or 5 consecutive small trend bars. There are many weekly and monthly magnets nearby. These also limit the chances of a trend day.
S&P500 Emini monthly and weekly candle charts
Because today is the end of the week and there is a 3 day weekend, traders might take some profits. This is especially true in an overbought market in all time frames when there is uncertainty about Russia.
The 60 minute chart yesterday has a gap bar. It was the first bar in several weeks where the high was below the moving average. Moving average gap bars late in trends usually lead to the final leg of the trend. The Emini would then try to create a major trend reversal on the rally. The rally does not have to go above the prior bull high, and instead could form a lower high major trend reversal.
Today is the last day of the week. Traders will look at support and resistance on the weekly candle chart as magnets at the end of the day. The week so far is a small doji and the open of the week is currently the obvious magnet. Since the week has been small, the high and low of the week are also magnets, as is last week’s high. The psychological round number of 2,000 is also a magnet.
Today is the also last day of the month, so today’s close affects the appearance of the candle on the monthly chart. The candle is currently an outside up bar. This means that the current close is above the July high. Bulls see this gap as a potential measuring gap and look for a measured move up that is equal to about the height of the July candle.
Bears want the gap to be an exhaustion gap. They do not care if September trades a little higher as long as it reverses down below the July high. They prefer September to be a bear candle and either be a reversal bar or a bear inside bar. This would create a second sell signal in a very overbought monthly chart (June was the first signal bar). Since the monthly chart is so overbought, they expect at least a pullback, which may only last a few bars. However, on the monthly chart, a pullback could be 100 points or more.
See the weekly update for a discussion of the weekly chart.
Traders can see the end of the day bar-by-bar price action report by signing up for free at BrooksPriceAction.com. I talk about the detailed Emini price action real-time throughout the day in the BrooksPriceAction.com trading room, and a 2 day free trial is available.
When I mention time, it is USA Pacific Standard Time (the Emini day session opens at 6:30 am PST, and closes at 1:15 pm PST). You can read background information on the intraday market reports on the Intraday Market Update page.

