Posted 7:05a.m.
Yesterday ended with a 60 minute spike and channel bottom. The odds favor a 2 legged rally today on the 60 minute chart. This means that bulls will look to buy a pullback. Since the 60 minute chart is in a trading range, the pullback can be deep. Yesterday’s 60 minute bear channel will probably be followed by a 60 minute trading range today, but the range still could have big swings on the 5 minute chart.
The midpoint of the week is around 2095, as is the 60 minute moving average. The top of yesterday’s bear swing is just above. These will probably all be magnets for the first hour or two. The Emini continued yesterday’s rally on the open, and this is probably the end of the 1st leg up. The pullback can last an hour or two. The 60 minute bulls will then look for a 2nd leg up. The pullback might end around last week’s low of 2083.75, which was important support and then resistance yesterday.
At the moment, the S&P Emini futures contract is always in long, but at resistance. The odds favor an early high that will lead to a pullback to support, possibly around last week’s low. Then, the 60 minute chart should try for a 2nd leg up. These reversals mean that a trading range is likely for several hours. There should be a selloff soon. Less likely, the Emini will continue up in a strong bull trend.
My thoughts before the open: Swing trading strategy for a wedge bull flag
Today is Friday and the most important price on the weekly chart is last week’s low of 2083.75. This week is an outside down week after a breakout above a weekly tight trading range. That means that this week is a final flag reversal down from the all-time high, and it is occurring in an extremely overbought market. There is an 80% chance that the Emini will fall to the monthly moving average this year, and this week is a reasonable candidate for the start of the correction. The bears need follow-through over the next several weeks, else the bull trend will continue.
The Globex session is up a little and yesterday ended with a reversal. The bulls today need to prevent continued selling by the bears. However, if the best the bulls can do is rally about 50% of the way back to the all-time high, they might be setting up a lower high major trend reversal on the 60 minute chart. They need to reverse the bearish weekly candle pattern. At a minimum, they need to get today’s close back above last week’s low. Next, they need the close above the middle of this week’s range. It is unlikely that they will get the close back up to the high of the week.
What is the day trading tip for online day traders today? Watch for an attempt by the bulls to reverse yesterday’s selloff and to erase some of the bearishness of this week’s candlestick pattern. Traders learning how to trade the markets should look at the 60 minute chart. The candlestick pattern is a spike and channel bear trend over the past week. There is usually a reversal sideways to up that has at least 2 legs and 10 bars. This means that the odds today are for at least a trading range or a rally.
The best Forex trading strategy today for Forex traders is to look for the EURUSD to enter a trading range after an extreme rally that now has consecutive sell climaxes and a wedge top. Online currency traders will begin to sell new highs and rallies for Forex scalping. They will continue to buy pullbacks. The weakness in the British pound is climactic and should have a pullback today.
Summary of today’s S&P Emini futures price action and what to expect tomorrow
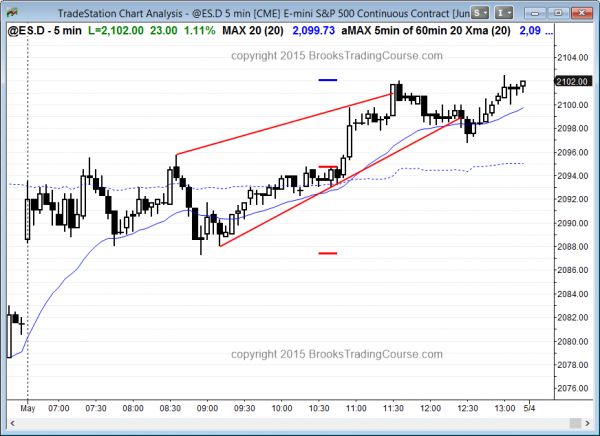
The bulls had a trending trading range day after yesterday’s 60 minute wedge bottom.
The S&P Emini futures contract was in a small trading range for several hours. This made a breakout into a Trending Trading Range day likely, and that is what happened. The bulls expect 2 legs up from yesterday’s 60 minute wedge bottom. Today is the first leg up. It might continue a little on Monday, but will then probably pull back. Then, it will try for the 2nd leg up. The bears will see this rally as the right shoulder of a head and shoulders top, which is a 60 minute lower high major trend reversal. The bulls want a breakout to a new all time high and then a measured move up. It is unlikely that they will get their measured move up if they get the bull breakout, but they still might get several strong days up. At that point, the odds are that the breakout above the weekly tight trading range will fail.
See the weekly update for a discussion of the price action on the weekly candlestick chart and for what to expect going into next week.
Traders can see the end of the day bar-by-bar price action report by signing up for free at BrooksPriceAction.com. I talk about the detailed S&P Emini futures price action real-time throughout the day in the BrooksPriceAction.com trading room, and a 2 day free trial is available.
When I mention time, it is USA Pacific Standard Time (the Emini day session opens at 6:30 am PST, and closes at 1:15 pm PST). You can read background information on the intraday market reports on the Intraday Market Update page.


