Posted 6:49 a.m.
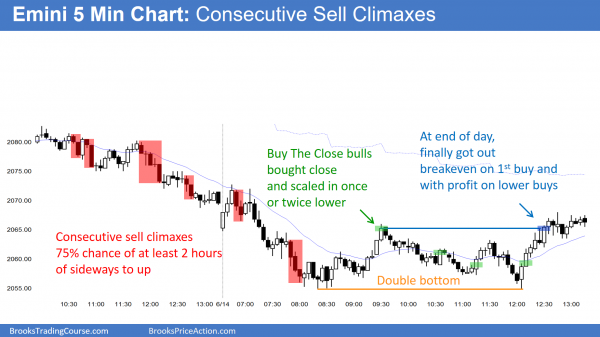
The Emini gapped down, but closed the gap on the 2nd bar. This was also a failed breakout below yesterday’s bear channel. There is a 75% chance of the Emini reaching the top of the channel, and it can get there by going sideways or up. The Emini is Always In Long. The bears want this rally to fail and become and Opening Reversal down for an early high of the day. They have about a 30% chance of success.
Because the bars are not especially big and they have tails, and the Emini is stalling at the moving average, the odds are that today will not be a strong bull trend day. However, it could be a weaker bull trend day, like a broad bull channel or a trending trading range day. The reversal up was strong enough so that the odds are that the Emini will be sideways to up for the first hour or two.
S&P 500 Emini: Learn how to daytrade candlestick reversal patterns
Pre-Open Market Analysis
When yesterday traded below Friday’s low, it triggered a sell signal on the weekly chart, giving daytraders a chance to learn how to daytrade candlestick reversal patterns. The weekly chart had its test of the 11 week bull micro channel high last week. As I have been saying for a month, the odds favored a marginal new high and then a pullback into a trading range. That might have begun Friday. The obvious target for the bottom of the trading range is the May low of 2013, which would be about 100 points below the all-time high, which was set last week. If the Emini gets there ans pauses, the weekly chart will then have a trading range that began with the end of the micro channel on April 22, and it will contain both a double top and a double bottom.
There is still a target above on the cash index. Last week’s rally came to within 14 points of the all-time high, and that high might be tested before the 100 point pullback comes. However, with the reasonable context and sell signal on the weekly chart, it more likely has already started. There is an FOMC meeting on Wednesday and again in July, and a Brexit vote next week. Any could lead to a violent move up or down, and the move could be the start of a trend up or down. Regardless of what the news is, the odds still favor a test of the May low over the next month or two.
The bears had a good day yesterday. I mentioned several times over the past 3 weeks that the May 25 gap up might be followed by a gap down at any point over the following month or more. If the gap down stayed open for a few days, the odds would begin to favor a measured move down based on the height of the island top. The Emini is down 7 points in the Globex session. If the day session opens here, there will be a gap down and an island top. If the Emini gaps down tomorrow and the gap stays open, the measured move target would be about 40 points, which would be close to the target of the May low.
Because yesterday’s selling was climactic, there is only a 25% chance of a strong trend day today, especially with some uncertainty about tomorrow’s FOMC announcement. There is not too much uncertainty because most traders doubt there will be a rate hike tomorrow. If there is, it could cause a Pain Trade, which is a big reaction to unexpected news.
There is a 50% chance of some follow-through selling in the 1st 2 hours. There is a 75% chance of at least 2 hours of sideways to up trading that begins by the end of the 2nd hour. The gap could easily close, especially if it is small. Bears will look for a trend from the open bear trend, and bulls will look for a reversal.
When there is a gap, the day is usually not especially big, and the Emini often goes sideways for a day or two afterwards as it decides whether to resume down or reverse up. Also, if this is the start of a bear trend on the daily chart, the Emini will tend to sell off at the end of the day, like yesterday. Day traders have to be ready for short trades in the final hour.
Forex: Best trading strategies
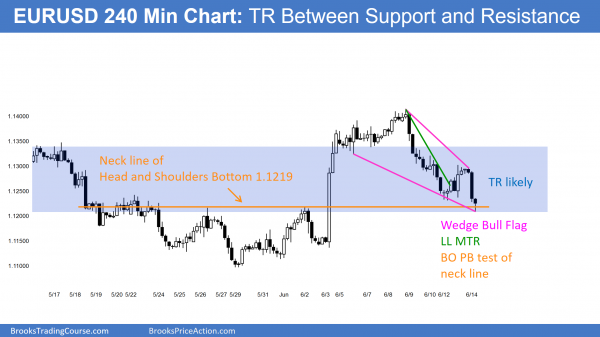
The EURUSD 240 minute Forex chart has pulled back from its breakout above a Head and Shoulders Bottom and is testing the neck line. After rallying strongly to the moving average yesterday (not shown), it sold off to a new low, which can be a Lower Low Major Trend Reversal (LL MTR). The selloff from the June 8 high is forming a wedge bull flag.
The EURUSD daily Forex chart has a series of 50% pullbacks over the past couple of months creating a tightening trading range. It is a type of triangle. The chart is in breakout mode, which means that a strong breakout up or down will probably run for about a measured move based on the 400 – 500 pip height of the 3 month trading range.
All financial markets are likely to reach to the FOMC announcements on Wednesday and in July, and to the Brexit vote next week. No one knows how big the move will be, nor do the know the direction. The EURUSD Forex chart is neutral. When a market is in Breakout Mode, there is a 50% chance that the 1st breakout will fail and reverse.
Although yesterday reversed up after pulling back from the rally of 2 weeks ago, the daily chart is probably in a 200 pip trading range, and many traders will wait for a strong breakout from any or all of the 3 news events before they swing trade on the daily chart. Day traders are mostly scalping because until the announcements, most traders will be unwilling to hold onto positions for too long. They will buy low, sell high, and take quick profits. The result is a trading range.
The overnight selloff is finding support at the 1.1200 neck line of the Head and Shoulders bottom of May 26 and June 2 on the 60 and 240 minute charts. I talked about this yesterday. If it bounces today, it will be from a wedge bull flag, a breakout test of the neck line, and a lower low major trend reversal. Although it sold off strongly over the past 6 hours in Europe, the context makes it likely to stabilize here. It might go sideways and wait for tomorrow’s announcement before deciding between reversing up from support, which is likely, or falling below support, which is less likely.
Summary of today’s S&P Emini futures price action and what to expect tomorrow
The Emini sold off in a series of sell climaxes, and then entered a trading range, as expected. It reversed up from a double bottom at the end of the day.
Although there is a consensus that the FOMC announcement tomorrow will be a non-event, there is always a possible big move on the report. There is at least a 50% chance that the initial move will reverse in a bar or two. When the report comes out, most traders should wait at least a couple of bars before trading.
Before the report, the day will be an ordinary day. Since the Emini is oversold on the 60 minute chart and ended today with a micro double bottom on the 60 minute chart, the odds are that the Emini will be sideways to up before the report. With the 60 minute chart oversold and the market wanting to be neutral before the report, the Emini will probably not have a bear trend before the report.
See the weekly update for a discussion of the price action on the weekly candlestick chart and for what to expect going into next week.
Traders can see the end of the day bar-by-bar price action report by signing up for free at BrooksPriceAction.com. I talk about the detailed S&P Emini futures price action real-time throughout the day in the BrooksPriceAction.com trading room, and a 2 day free trial is available.
When I mention time, it is USA Pacific Standard Time (the Emini day session opens at 6:30 am PST, and closes at 1:15 pm PST). You can read background information on the intraday market reports on the Intraday Market Update page.


