President Trump rally pulling back to August high breakout point
Updated 6:50 a.m.
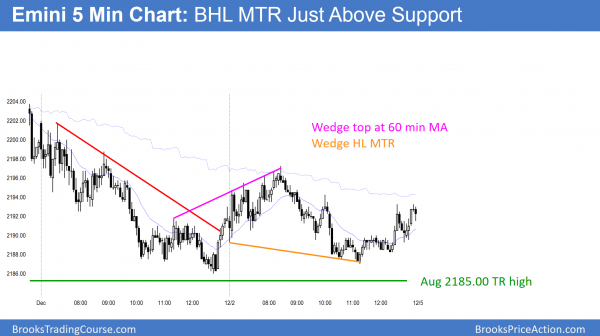
The Emini opened in the middle of the 60 minute moving average above and the August high below. Further more, it began with a bear doji, a rally, and reversal. It is therefore neutral and deciding whether to test support or resistance. This is another trading range open, which might last an hour or more. Furthermore, it reduces the changes of a strong trend day up or down.
The Emini was in a bear trend for 2 days. It broke above the bear channel late yesterday. Because channels usually evolve into trading ranges, the odds favor a lot of sideways trading today.
Pre-Open Market Analysis
The Emini sold off in a broad bear channel for 2 days. Furthermore, yesterday dipped below the November 18 high, which was the breakout point of the final 4 bar rally. Yet, it has not yet pulled back below the August high of 2185. That is the top of a trading range and therefore a major breakout point.
Because the Emini got to within 9 ticks of it, it will probably get there soon. The bulls are trying to create signs of strength. Hence, they will try to keep the gap open. Since the bulls got their new high after Monday’s break below the 12 day bull micro channel, the Emini might now go sideways to down for about 10 bars. The FOMC report on December 14 is especially relevant. The Emini will probably try to be neutral going into the report. It therefore might remain in a tight trading range until then.
Did the Emini top out this week?
Can Yesterday’s high be the start of a major move down. Because the rally from the November low was so strong, this reversal is probably minor. As a result, bulls will probably buy it and get at least one more new high. The bears will probably need a major top, like a major trend reversal or a wedge before they can get a significant pullback.
Overnight Emini Globex trading
The Emini is down 5 points in the Globex session, yet it traded in a tight range. Because it is still close the the August previous all-time high of 2185.00, bulls might hesitate to buy until after the gap below this week’s lows and that high closes. In any case, the odds are that the Emini goes mostly sideways for about 10 days after its 12 day bull micro channel. It therefore might stay in a tight range until the December 14 Fed interest rate hike.
EURUSD Forex Market Trading Strategies
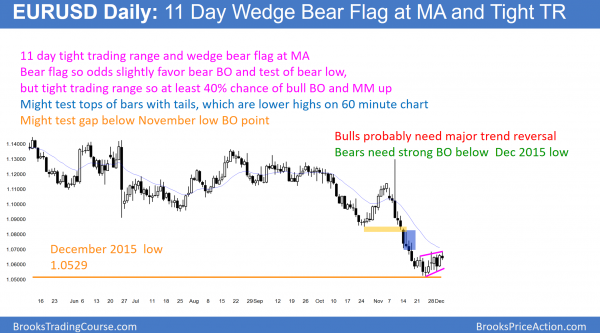
The daily EURUSD Forex chart has pulled back to the moving average. Furthermore, is has formed a wedge bear flag. Yet, because the bear flag is relatively flat and in a 12 day tight trading range, there is at least a 40% chance of a bull breakout and measured move up. The odds still favor at least a test down to the November low. The bulls will then try for a Major Trend Reversal. While the bears want a break below the 18 month trading range, a bounce is more likely because most trading range breakout attempts fail.
The EURUSD Forex chart has been in a tight trading range for 10 days. Because of the climactic test of support, I said that the minimum goal after the brief break below the December 2015 low was 10 bars up. Yet, I also said that the rally would probably have to reach the moving average, which means about 200 pips. That is still likely.
Since the selloff was so strong and the reversal up is probably minor, bears will probably sell around the moving average or the October low, just above 1.0800. Because the December 14 FOMC meeting could change all financial markets, the EURUSD might stay mostly sideways until the report.
Overnight EURUSD Forex trading
The EURUSD sold off overnight after testing the daily moving average. If today closes near the low of the day, today would be a good sell signal bar. Because the tight trading range is a wedge bear flag, it is a reasonable sell setup. Furthermore, I have been writing since the November low that this rally was probably a minor reversal. Therefore it was more likely to be a bear flag or leg in a trading range than a bull trend.
While the odds favor a bear breakout below the flag, the odds are against a successful break below the 18 month trading range. Trading ranges resist change. Hence, most breakouts fail. As a result, if there is a break below the bear flag, it will more likely create a major trend reversal buy setup.
Furthermore, the bulls have at least a 40% chance of simply getting a bull breakout above this bear flag. If so, they could get a measured move up that tests the October low.
While the EURUSD has sold off overnight, the swing down will probably be a leg within the 12 day trading range instead of the start of a bear trend. For 12 days, traders have taken quick profits because of the trading range. They will therefore do the same until there is a strong breakout.
Summary of today’s S&P Emini futures price action and what to expect tomorrow
After a wedge rally to the 60 minute moving average, the Emini reversed down to test the August high. That was the breakout point for the Trump rally. It then had a higher low major trend reversal, and close in the middle of the range.
Today was another trading range day. Like most recent days, it had swings up and down. After the Trump buy climax, the Emini appears to be going sideways into the December 14 FOMC meeting.
See the weekly update for a discussion of the price action on the weekly candlestick chart and for what to expect going into next week.
Traders can see the end of the day bar-by-bar price action report by signing up for free at BrooksPriceAction.com. I talk about the detailed S&P Emini futures price action real-time throughout the day in the BrooksPriceAction.com trading room. We offer a 2 day free trial.
When I mention time, it is USA Pacific Standard Time (the Emini day session opens at 6:30 am PST, and closes at 1:15 pm PST). You can read background information on the intraday market reports on the Intraday Market Update page.


