Likely 5 percent correction to Dow 20000 erasing 2017 gains
Updated 6:50 a.m.
Yesterday was a trading range day and today opened in the middle of yesterday’s range. Hence, the odds favor more sideways trading. Because yesterday had a bull body after Tuesday’s big bear breakout, it is a buy signal bar on the daily chart. Therefore, traders want to see if there are more buyers or sellers above its high.
Today began with 2 big dojis in yesterday’s trading range. In addition, limit order bull and bear scalpers made money in the 1st 3 bars. Hence, this is more trading range price action, and it therefore increases the chances of a lot of trading range trading today. Because of the big day on Tuesday, there is an increased chance of a trend day. Yet, this early price action and yesterday’s trading range make a trading range day more likely.
Pre-Open market analysis
Tuesday was a big bear trend day, but yesterday was a trading range day. It was therefore a bad follow-through day for the bears. Yet, the bear breakout was big. In addition, it closed well below the lows of the prior 20 bars on the daily chart. Furthermore, the Emini reversed down from a measured move target on the monthly chart. Finally, the high on the weekly chart was exceptionally far above the moving average. As a result, this is good context for a pullback to the December close. Hence, there is a 50% chance that Tuesday’s bear breakout was the start of the correction. This is true even if there is a rally over the next week or two.
Unless the bulls break to a new high, the odds favor lower prices. In addition, there is a 60% chance of a test of the target within a couple months. Furthermore, there is a 70% chance of the correction at some point this year.
Selloff was in part cause by options sellers who were hedging
Since Tuesday was a series of big sell climaxes, only about half of the selling was caused by traders being bearish. The other half was created by option selling institutions.
When the market falls quickly, puts quickly become profitable. These options sellers are therefore holding losing positions and the losses are accelerating. They therefore have to short the stock market to hedge their positions. They are not bears, but they are selling huge volume, and that adds to the sell climax. Hence, the day falls much further than it would if the bears alone were responsible.
Overnight Emini Globex trading
The Emini is up 4 points in the Globex session. Since yesterday was a bad follow-through day for the bears, the bulls see yesterday as a High 2 buy signal bar. Hence they believe that the 2 legs down from the all-time high is simply a bull flag.
Because the context is good for the bears and Tuesday was an exceptional bear day, the odds are that the 5% correction has begun. Since yesterday was a good bar on the daily chart for the bulls, the odds are that the Emini will rally for 1 to 10 days before the bear swing resumes down to the December close. The bulls need to break strongly above Tuesday’s high to take control of the stock market again.
EURUSD Forex market trading strategies
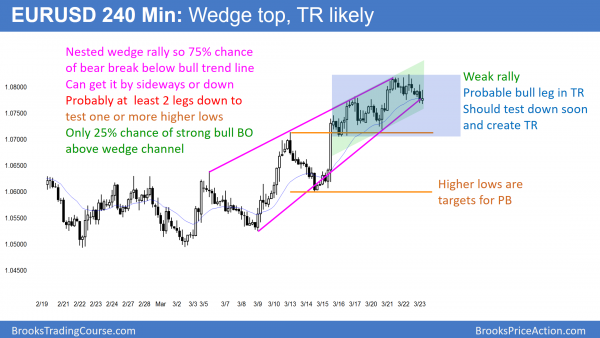
The 240 minute EURUSD Forex chart has been rallying for 4 weeks. Yet, the rally over the past 6 days has had many reversals and bear bars. It therefore is probably the start of a trading range.
While the daily EURUSD chart has been rallying up from a higher low major trend reversal for 4 weeks, it has not yet strongly broken above the neck line. In addition, the rally is a wedge top on the 240 minute chart. Furthermore, it has been especially weak over the past 6 days. These 6 days look like a bull leg in a trading range. Hence, the EURUSD chart will probably pull back to test the most recent higher low, which was Tuesday’s low.
Because the daily chart is at the neck line of a head and shoulders bottom, there is a 40% chance of a strong breakout and a measured move up. Yet, there is no breakout yet. There is a 60% chance of either a reversal back down in the 5 month trading range or the transition into a tight trading range.
Since the chart is at critical resistance, there is an increased chance of a big move up or down. But, the weakening of the rally over the past week makes sideways likely for a few days.>
Overnight EURUSD Forex trading
The EURUSD Forex market continued yesterday’s small range overnight. In addition, there is no sign of a breakout. Since the 4 week rally is stalling, the odds favor another trading range day today. However, since the chart is at critical resistance, there will probably be a big move up or down that starts within a week or two.
Summary of today’s S&P Emini futures price action and what to expect tomorrow
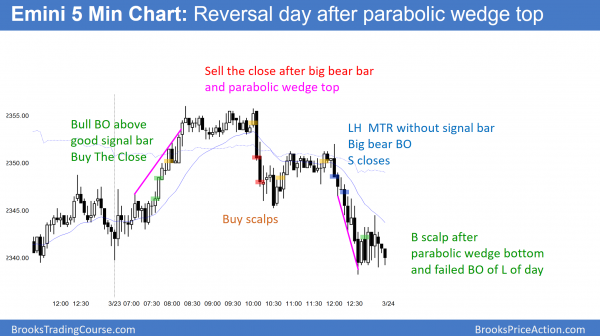
The Emini rallied to above the neck line of the double top on the daily chart, and above the 60 minute moving average. Yet, it reversed down from a parabolic wedge top.
The Emini reversed down from the 60 minute moving average. Today is therefore a Low 1 sell signal bar on the daily chart. Furthermore, the daily chart is Always In Short. The odds favor a selloff to the December close within a couple of months. Yet, the bulls still might get one more push up to test Tuesday’s sell climax high before the bear trend becomes clear.
See the weekly update for a discussion of the price action on the weekly candlestick chart and for what to expect going into next week.
Traders can see the end of the day bar-by-bar price action report by signing up for free at BrooksPriceAction.com. I talk about the detailed S&P Emini futures price action real-time throughout the day in the BrooksPriceAction.com trading room. We offer a 2 day free trial.
When I mention time, it is USA Pacific Standard Time (the Emini day session opens at 6:30 am PST, and closes at 1:15 pm PST). You can read background information on the intraday market reports on the Intraday Market Update page.


